
Every 300% move started with MTIF
Multi-Timeframe In Force

A big shout out to Solanki — this article wouldn’t exist without a brief but genuinely insightful conversation we had earlier this week. We were talking about how TheStrat changes more than your trading. It changes how you think. It reframes the questions you ask of a chart.
One question that stayed with me even after we finished our conversation sits at the heart of today’s stack:
How do you find a stock before it makes its big move?
For me, three of the most under-discussed concepts in TheStrat are
Reclaim
The Next 2
In force
I covered Reclaim and the Next 2 in a previous articles.
The concept already exists inside TheStrat. It just hasn’t had a name. Today I want to give it one: Multi-Timeframe In Force — MTIF.
The Paradox of the “Perfect Entry”
There is a peculiar torture that belongs exclusively to traders. It is the experience of watching — weeks or months later — a stock you studied, maybe even nearly bought, go on to make 300% without you.
The usual explanation is psychological. You lacked conviction. You hesitated. You got scared.
But that is only partly true.
Most traders do not miss these moves because they are weak. They miss them because
Most traders do not have a usable mental model for how big moves actually develop.
A stock pushes into all-time highs and immediately the same thought appears: surely it has gone too far.
TheStrat too gives you an easy get out of jail card — magnitude has been hit. The move looks extended. The obvious fear is that you are the last buyer in.
That fear sounds sensible. It even sounds disciplined. But it often rests on a false assumption — that a stock at all-time highs is closer to the end of the move than the beginning.
In reality, some of the market’s strongest moves happen precisely when price enters discovery and there is no overhead resistance left. Research on momentum published in 2024 found that stocks close to historical highs generated a disproportionate share of momentum returns, contributing 70% of returns while making up 45% of momentum holdings. Fidelity makes a similar point at the index level: historically, new all-time highs have often led to further all-time highs rather than immediate collapse.
So the real question is not, is this stock too high to buy?
The real question is:
Does this move still have structural energy behind it?
And that is where most traders get stuck. They can see price moving. What they cannot easily see is whether the move is still being fuelled across timeframes, or whether it is running on fumes.
Here is what we know about 300% moves. None of them started as 300% moves.
To make 300% in a year, a stock first needs to make 100% in a quarter. To make 100% in a quarter, it needs to make 20% in a week.
Clearly this isn't some new unique trading insight. But simple arithmetic, deployed at the right moment, has a way of becoming something much more powerful.
What it tells you is this:
The 300% move and the 20% weekly move are the same move, seen from different lenses. The question is not whether you have the conviction to hold through 300%. The question is whether you can recognise the 20% weekly move as the beginning of something much larger — before it proves itself.
That is what MTIF makes visible. It is the mechanism that lets you hold a runner all the way to 300% — not on blind faith, but on structural evidence..
The chart already knows
In the 1960s, a researcher named Amos Tversky began a series of experiments that would eventually overturn a century of assumptions about how people make decisions. One of his key findings was deceptively simple: people consistently underweight base rates. They ignore the statistical context. They focus on the vivid, the recent, the emotionally available — and miss the structural signal hiding in plain sight.
Us traders do exactly this, every day.
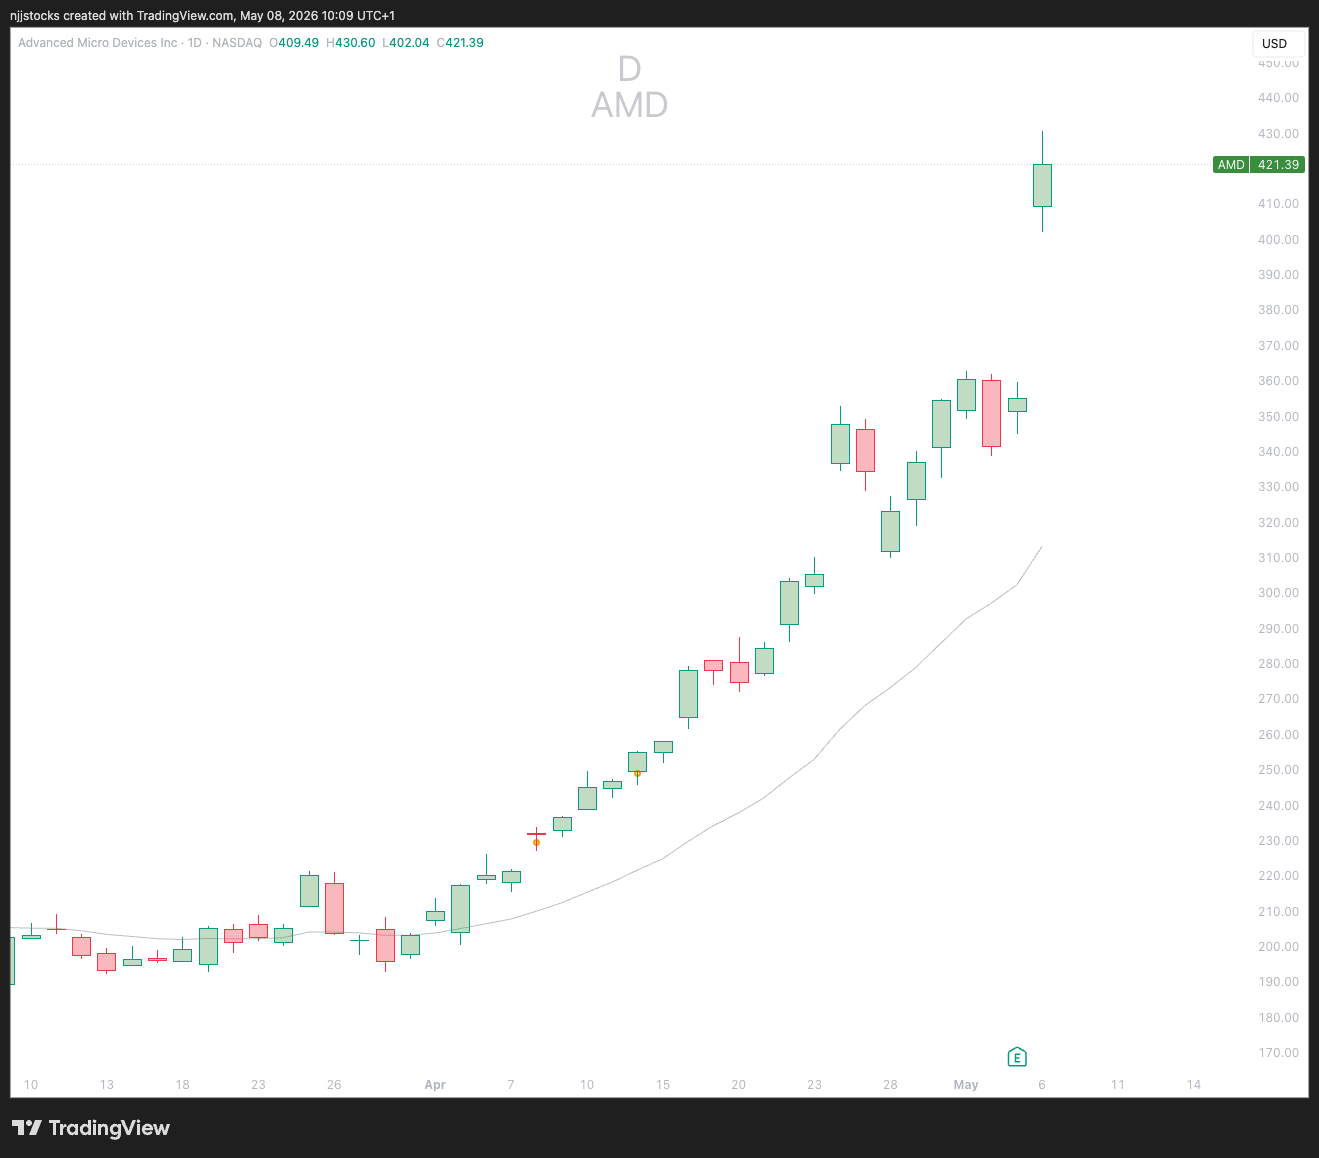
When AMD climbed from $190 to above $420 in the move visible on the chart above, the financial media responded — eventually. Analysts updated price targets. Retail traders noticed volume.
The stock became a story.
But the structure had been signalling for weeks before any of that. It didn’t take the form of loudly generated headlines. But in the quiet, methodical language of what TheStrat calls In Force.
A timeframe is In Force when the current candle’s close has broken beyond the prior candle’s high or low. Bullish In Force means buyers have taken control — the prior range broken to the upside. Bearish In Force means sellers have taken control. If it closes within the range of the prior candle’s range means no directional commitment yet.
⚠️ Pay attention to the really nuanced distinction between an inside candle and not in force. While talking about in force we are only interested in the final close not the whole range of the candle.
This is, on the surface, a simple definition. But its implications are not simple at all. It tells you whether a timeframe has made a commitment — whether the market, at that level of the structure, has resolved its ambiguity and chosen a direction.
A market that has chosen a direction — behaves differently from one that hasn’t.
Alignment ≠ Commitment
FTFC = Alignment
In force = Commitment
The stacking of commitment
You are familiar with Full Timeframe Continuity — the condition where all the major timeframes are aligned in the same direction, one of the foundational pillars of TheStrat.
MTIF is similar. We are talking about a ticker being In Force across multiple time frames.
A stock can be aligned across multiple timeframes [FTFC] without being In Force across multiple timeframes.
MTIF is the highest indication of institutional interest .
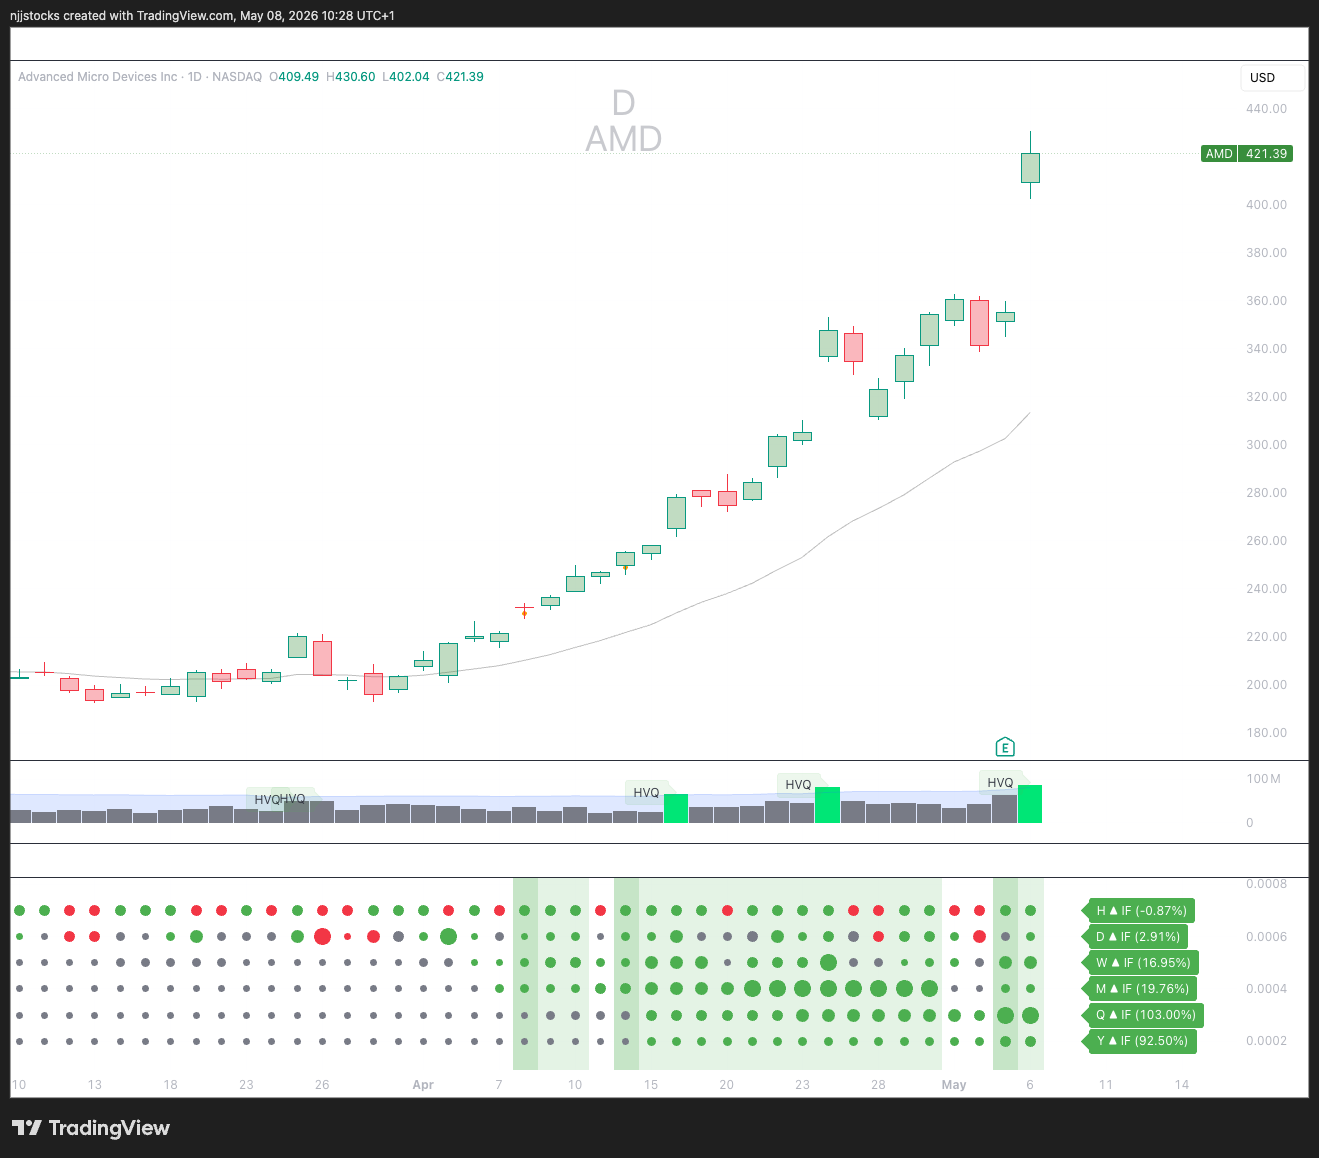
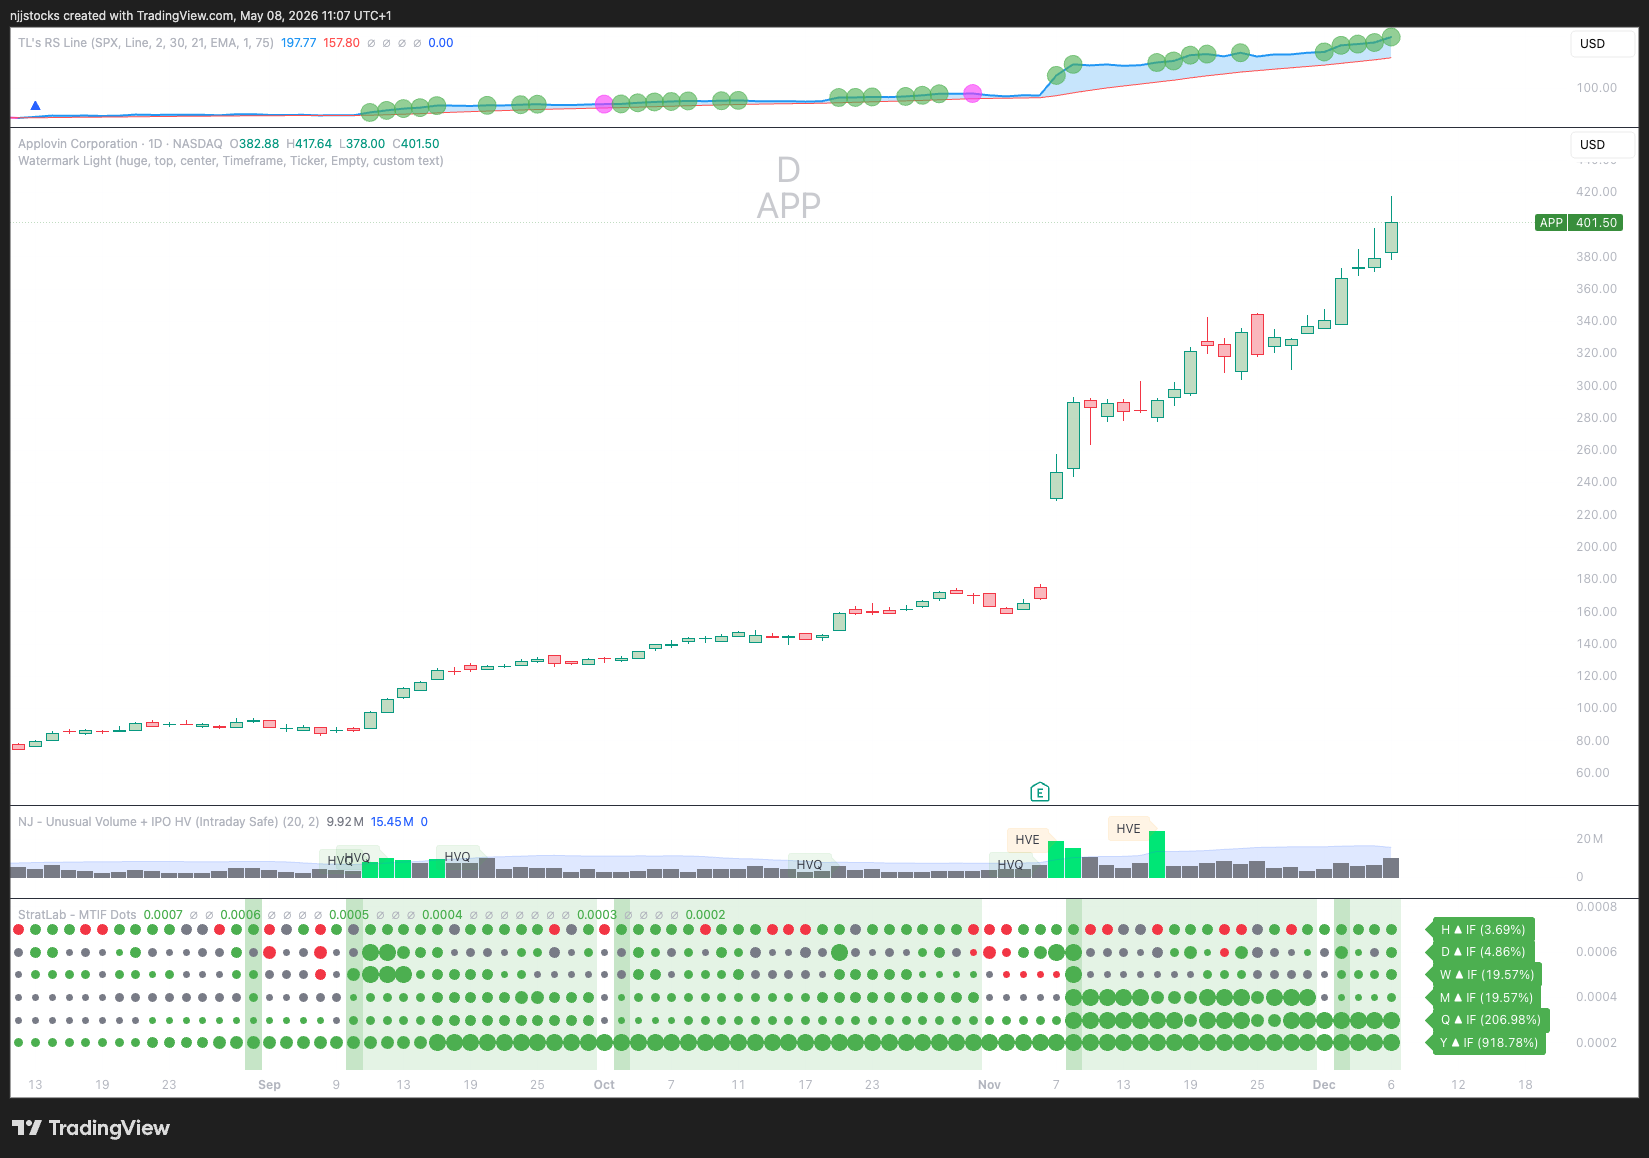
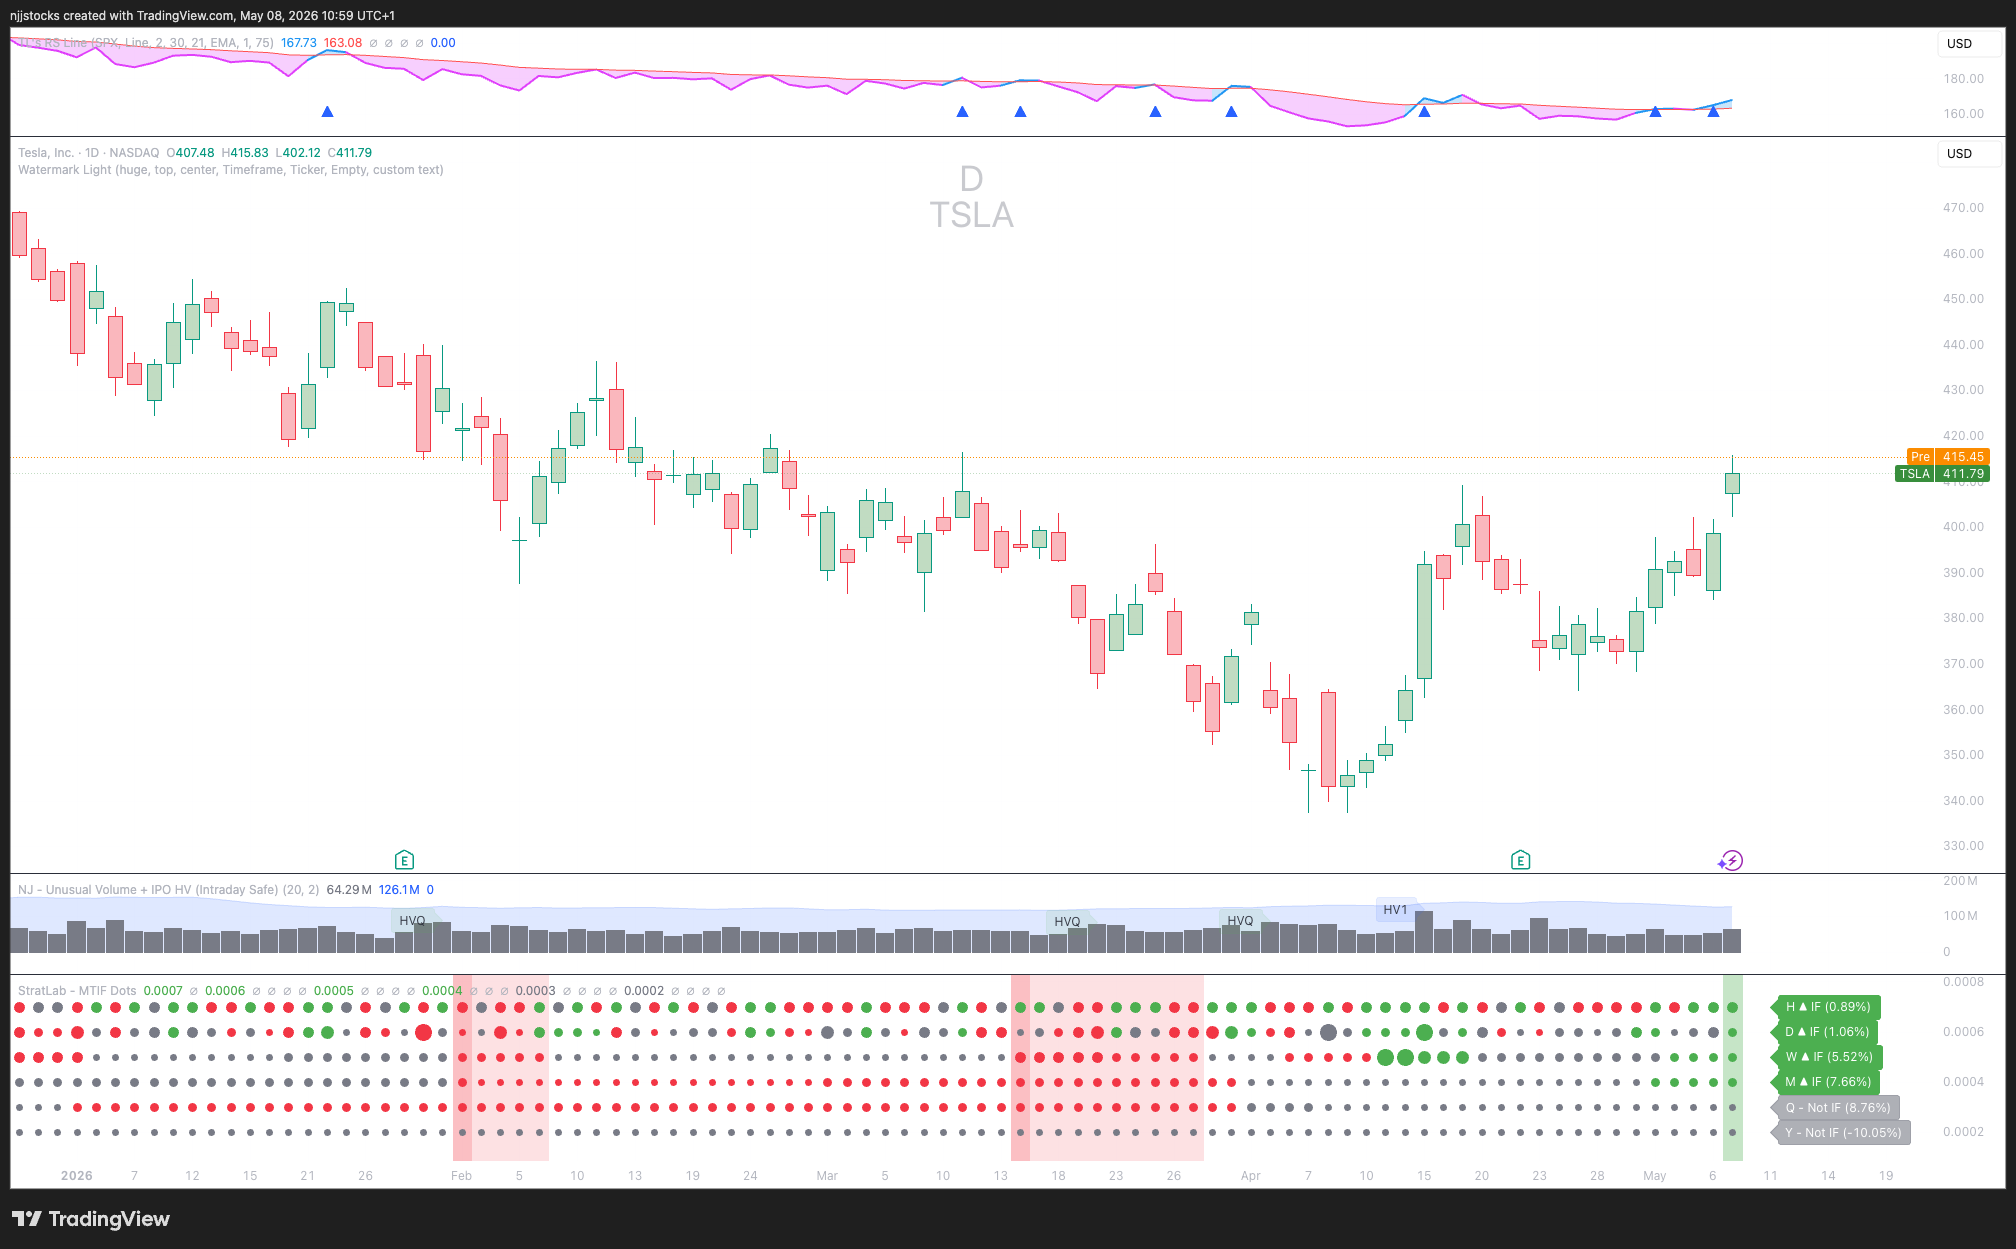
Visualising MTIF
The dots panel beneath the price action has six rows. one for each timeframe.
Each dot is green, red, or grey — Bullish In Force, Bearish In Force, or no commitment. The size of the dot grows as the candle stretches further from its open, scaled to the stock’s own Average Daily Range [ADR]. A small dot means early commitment. A large dot means extended momentum. When three or more timeframes align consecutively, the background turns green or red.
How to use it
The practical workflow that follows from MTIF is straightforward:
Scan for Q and Y Bullish In Force — these are your macro candidates
Wait for M to confirm — the monthly going In Force dramatically raises the probability of a sustained move
Watch for W to trigger — weekly In Force with monthly, quarterly and yearly all green is your highest-conviction entry context
Use D and H for entries — Wait for a daily/hourly actionable signal to enter. Don’t be the first to enter. Enter on the first signs of strength after a temporary weakness.
Build your own conviction [BYOC]
But do not take my word for this. In trading, borrowed conviction never holds up under pressure. If you want to trust a structural concept like MTIF enough to actually hold a 300% move, you have to build the evidence yourself.
Open your charts. Turn on the bar replay tool. Go back to the quiet weeks before the acceleration and step forward, one candle at a time. Watch the timeframes stack. Watch the structure load before the price explodes.
Here is a practical tip for TradingView: when you run a replay on the daily chart, set the update interval to one hour. This gives you a realistic feel for how a day actually develops. A stock can do a lot of things during market hours to shake you out, but watching that intraday noise unfold teaches you why the close is the only thing that matters. The intraday movement is just negotiation. The close is the verdict.
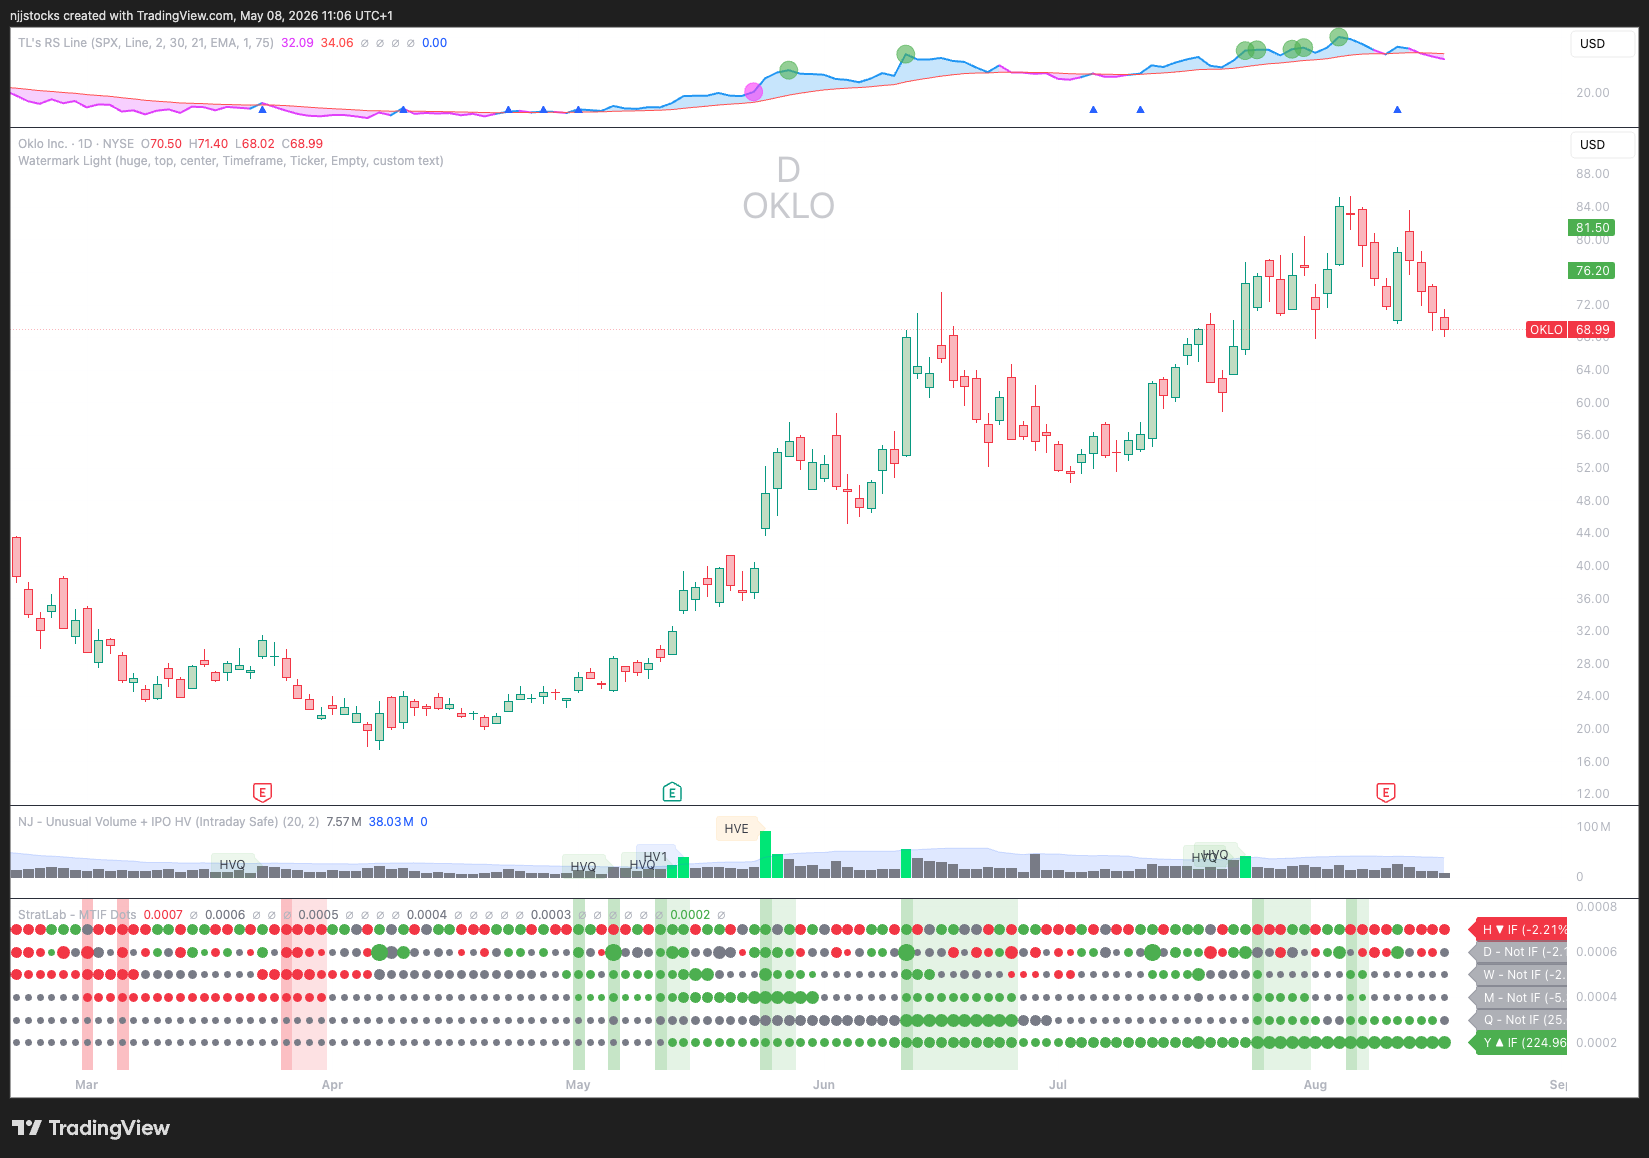
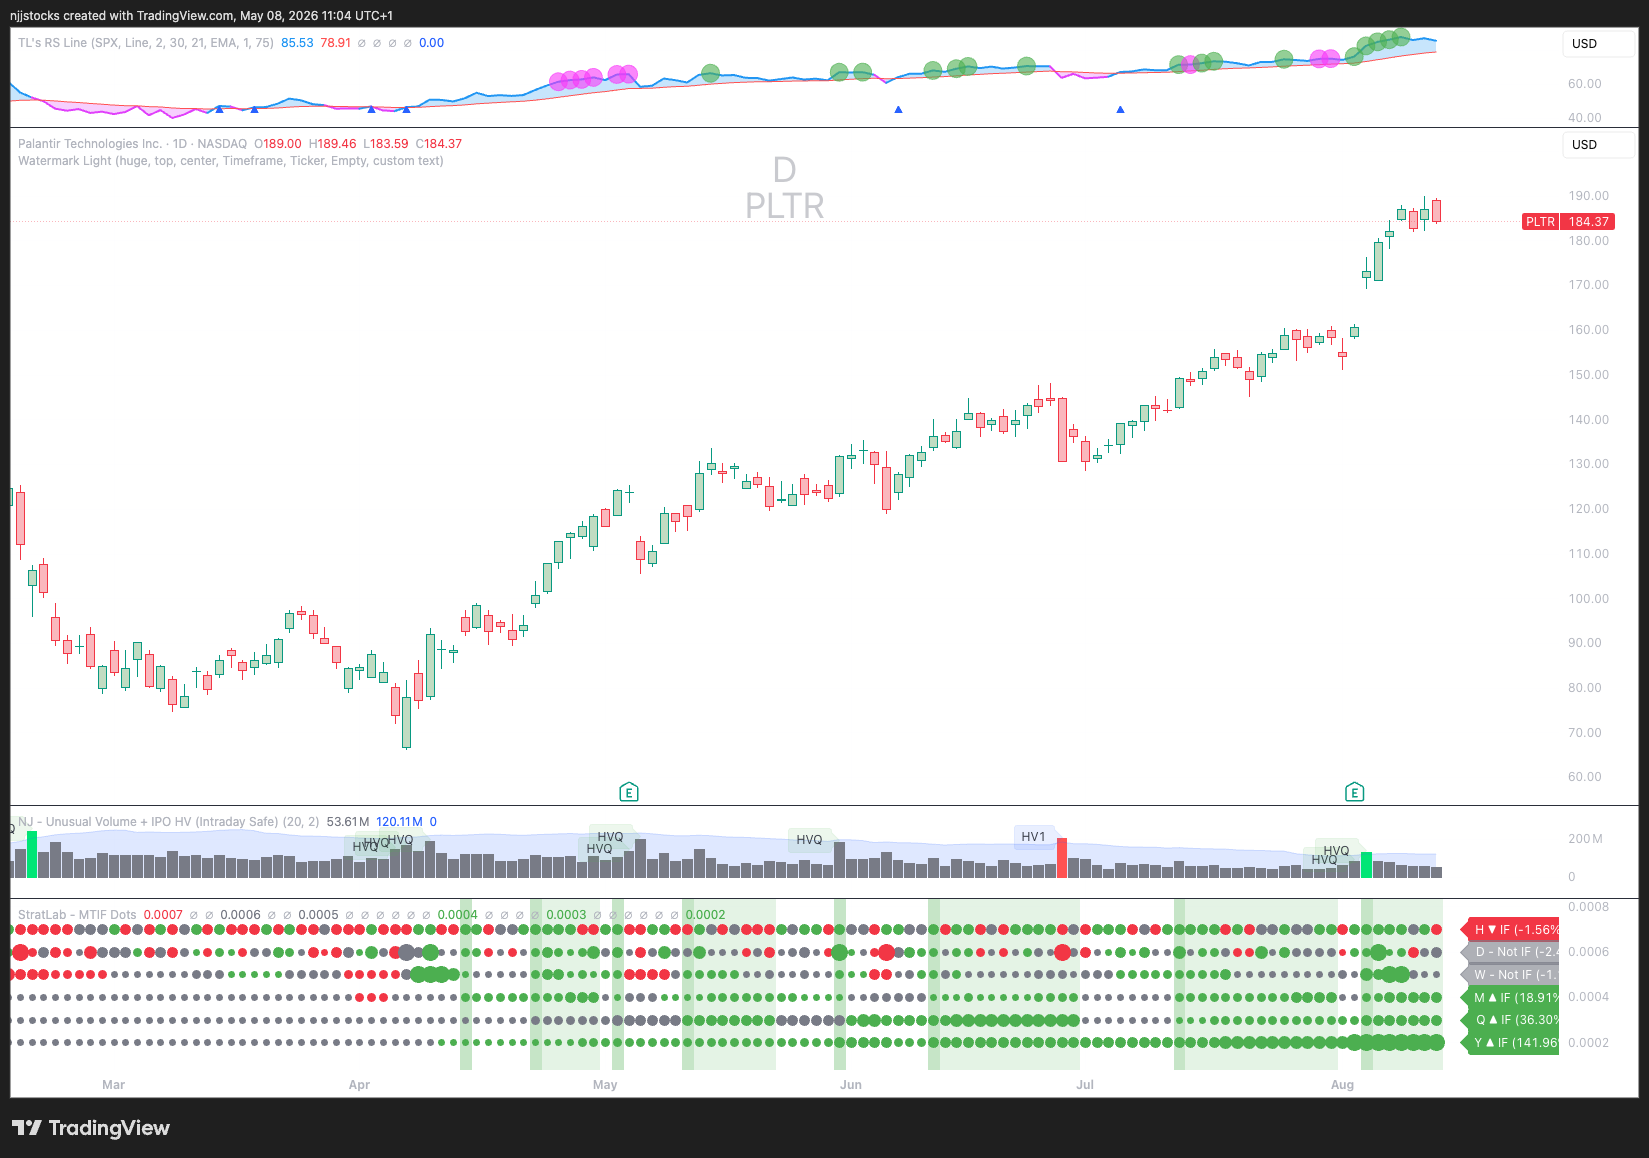
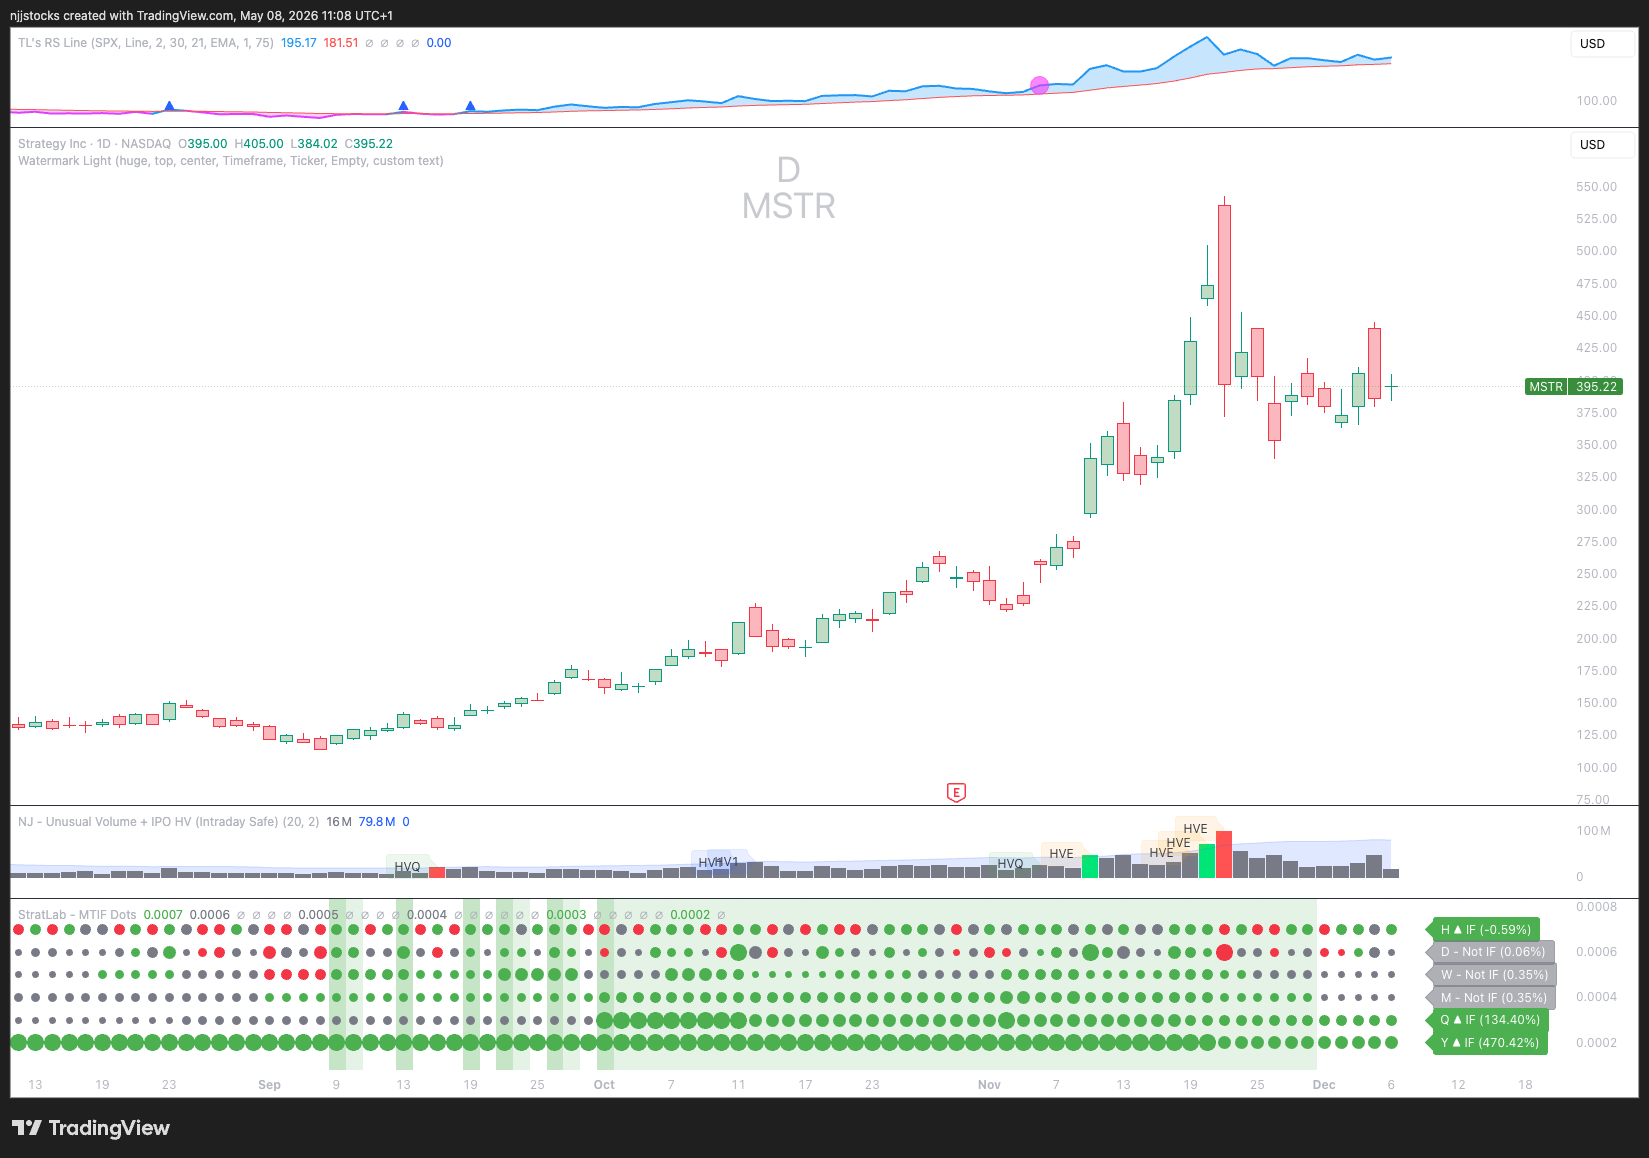
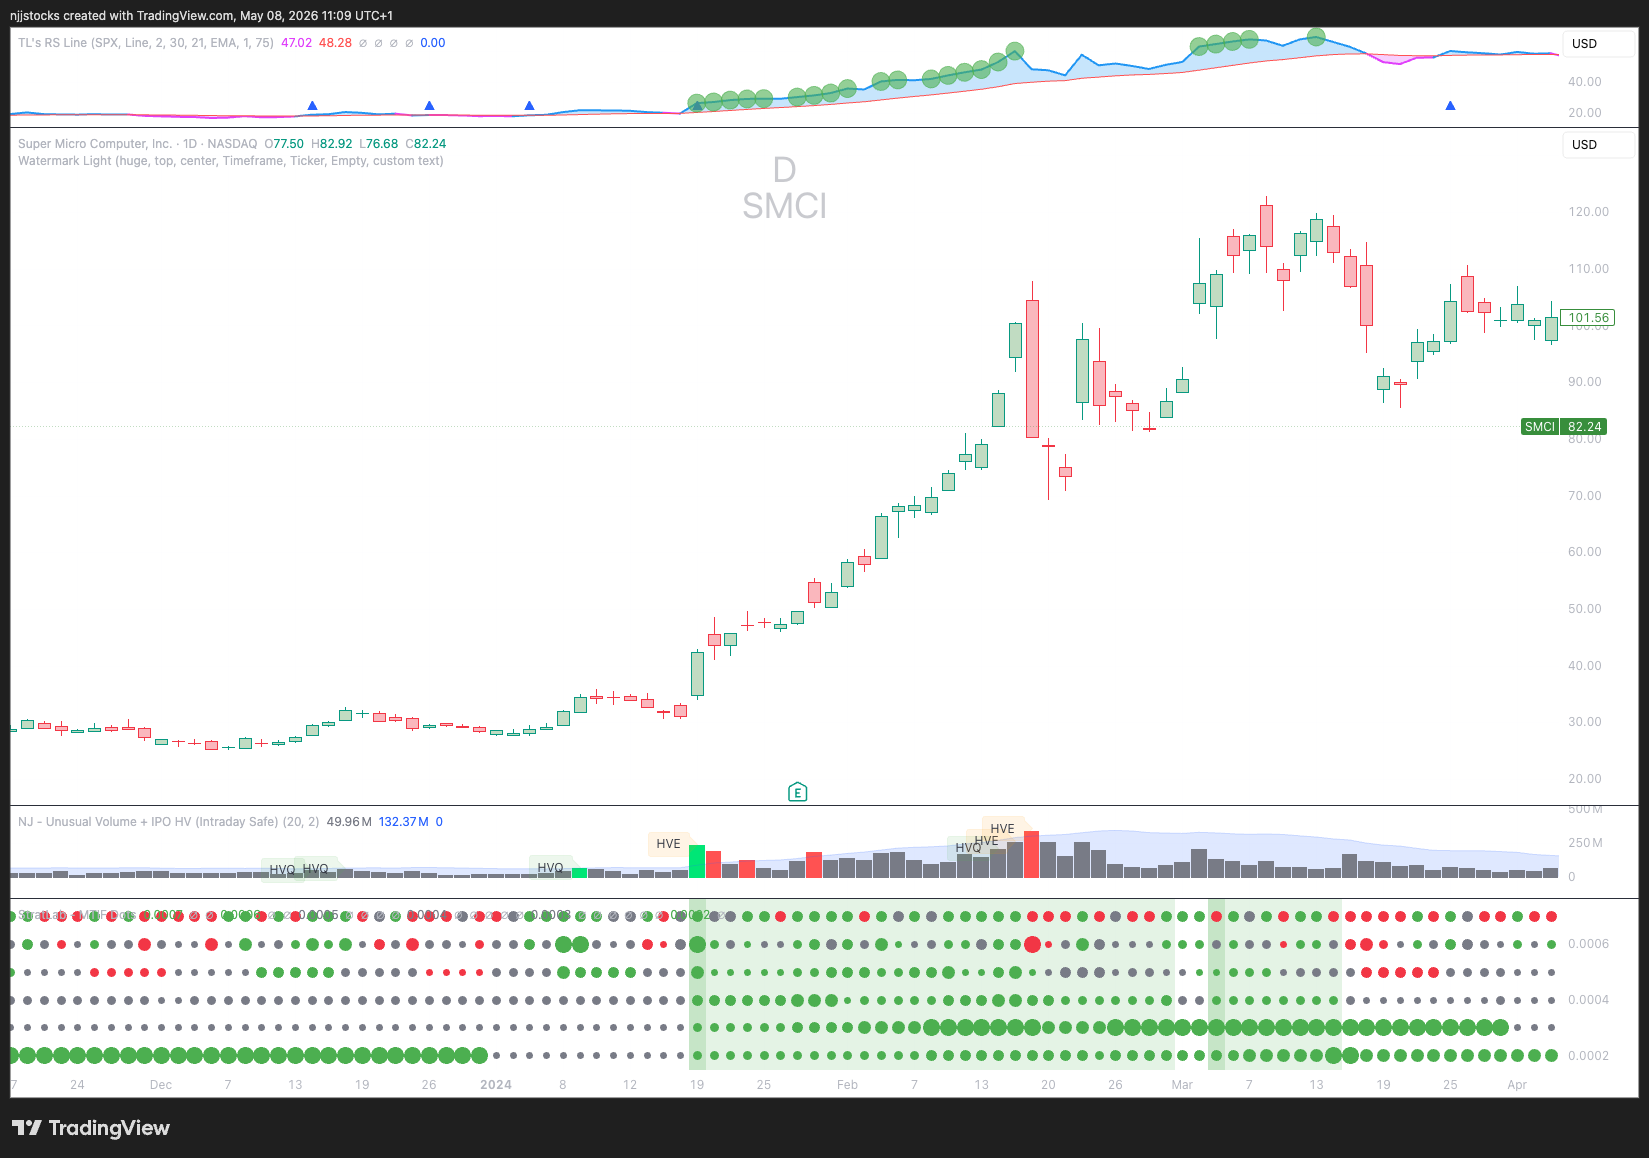
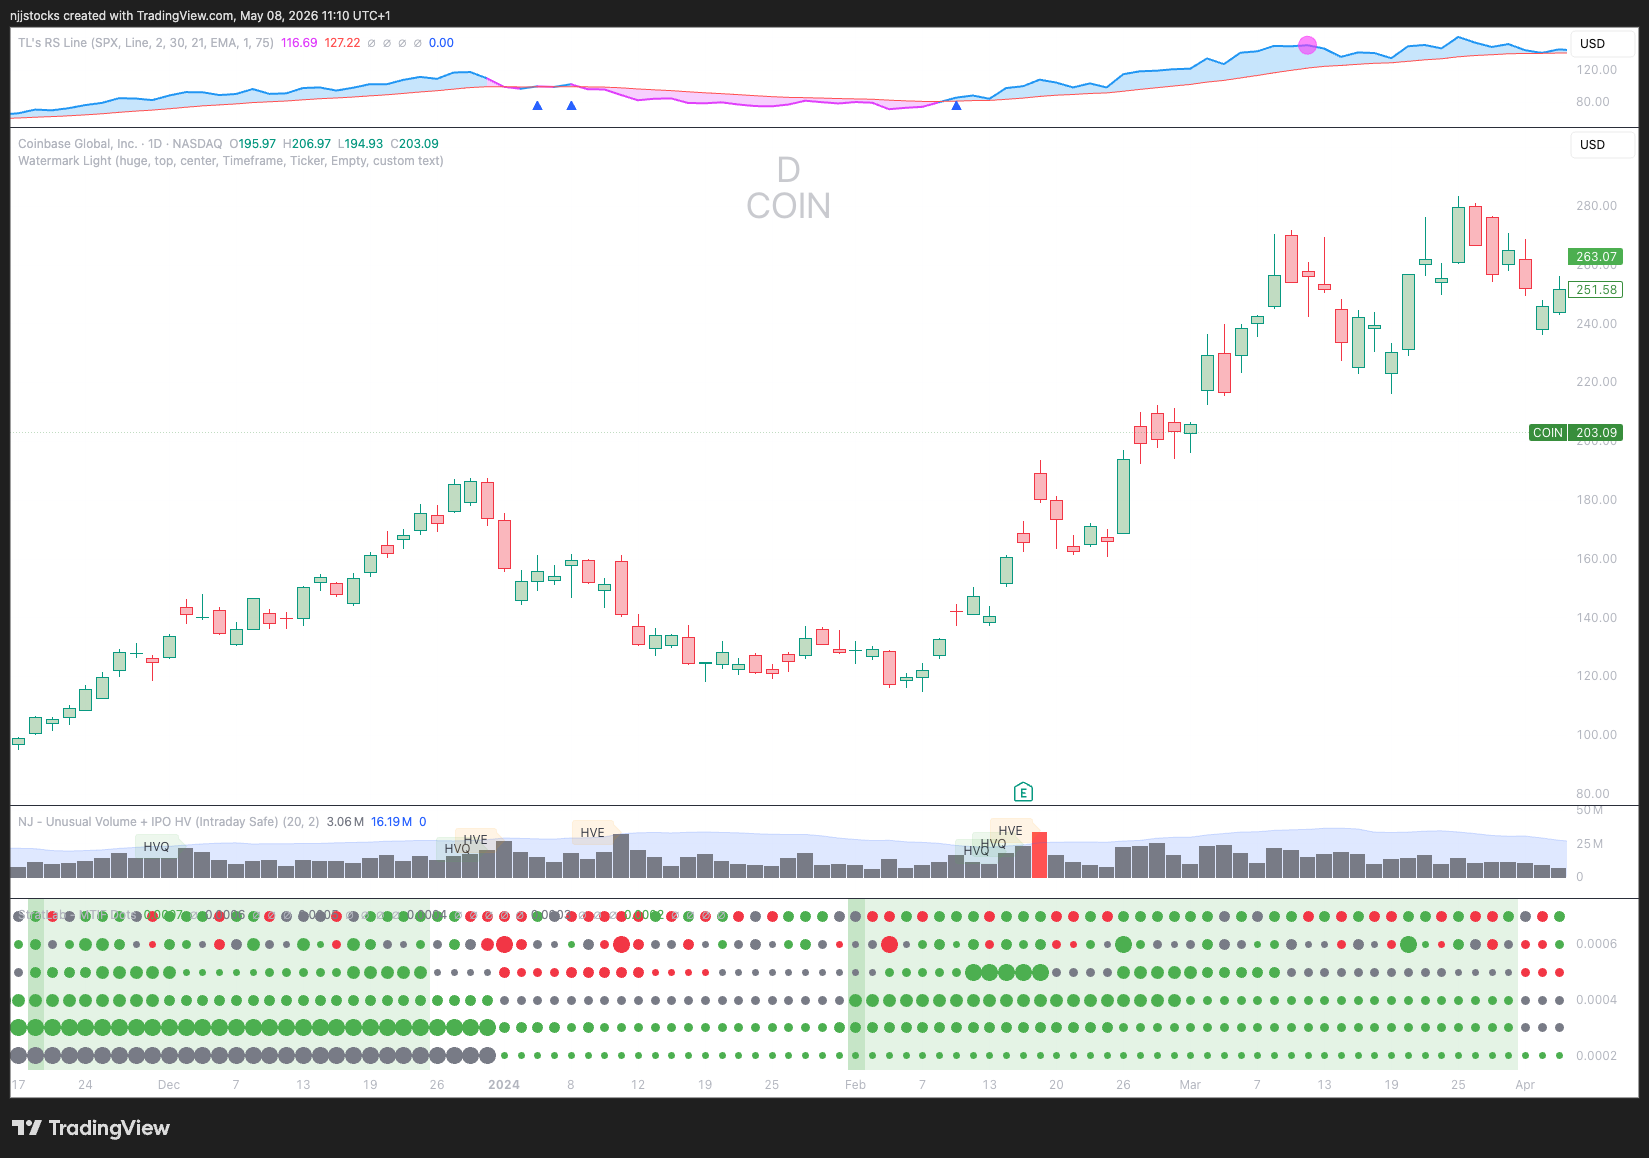
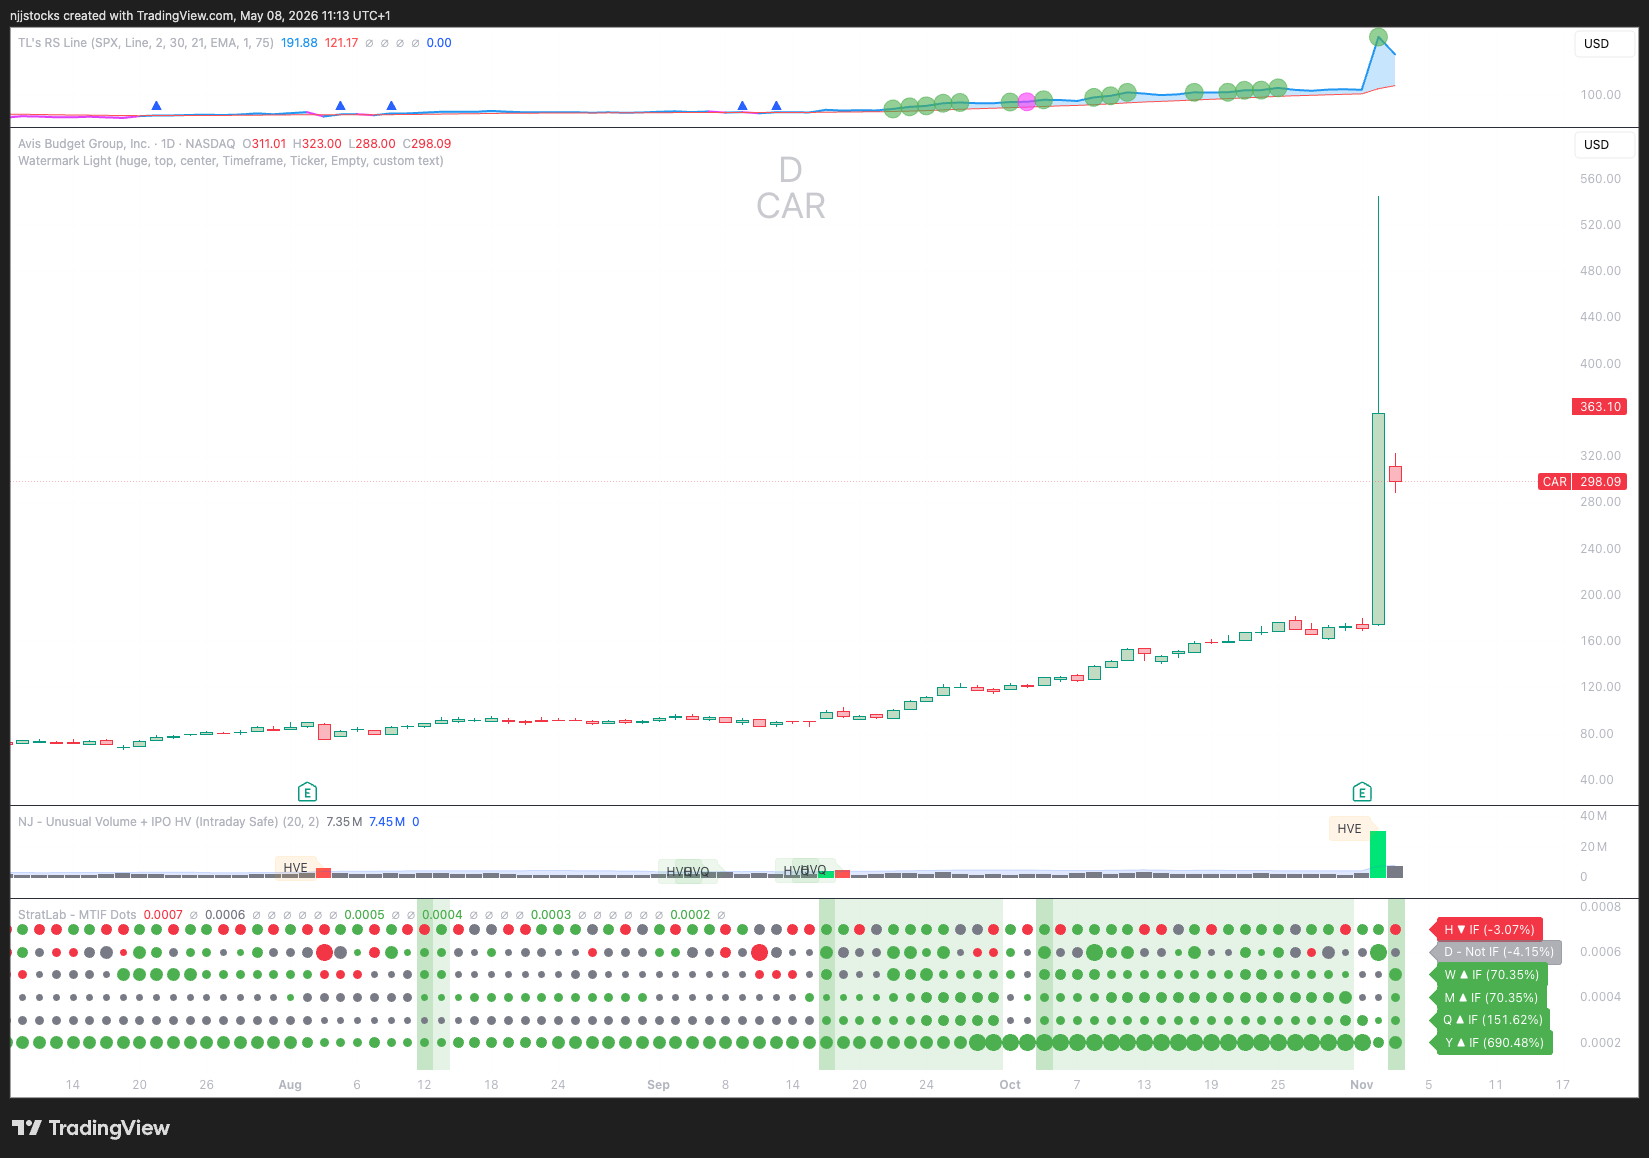
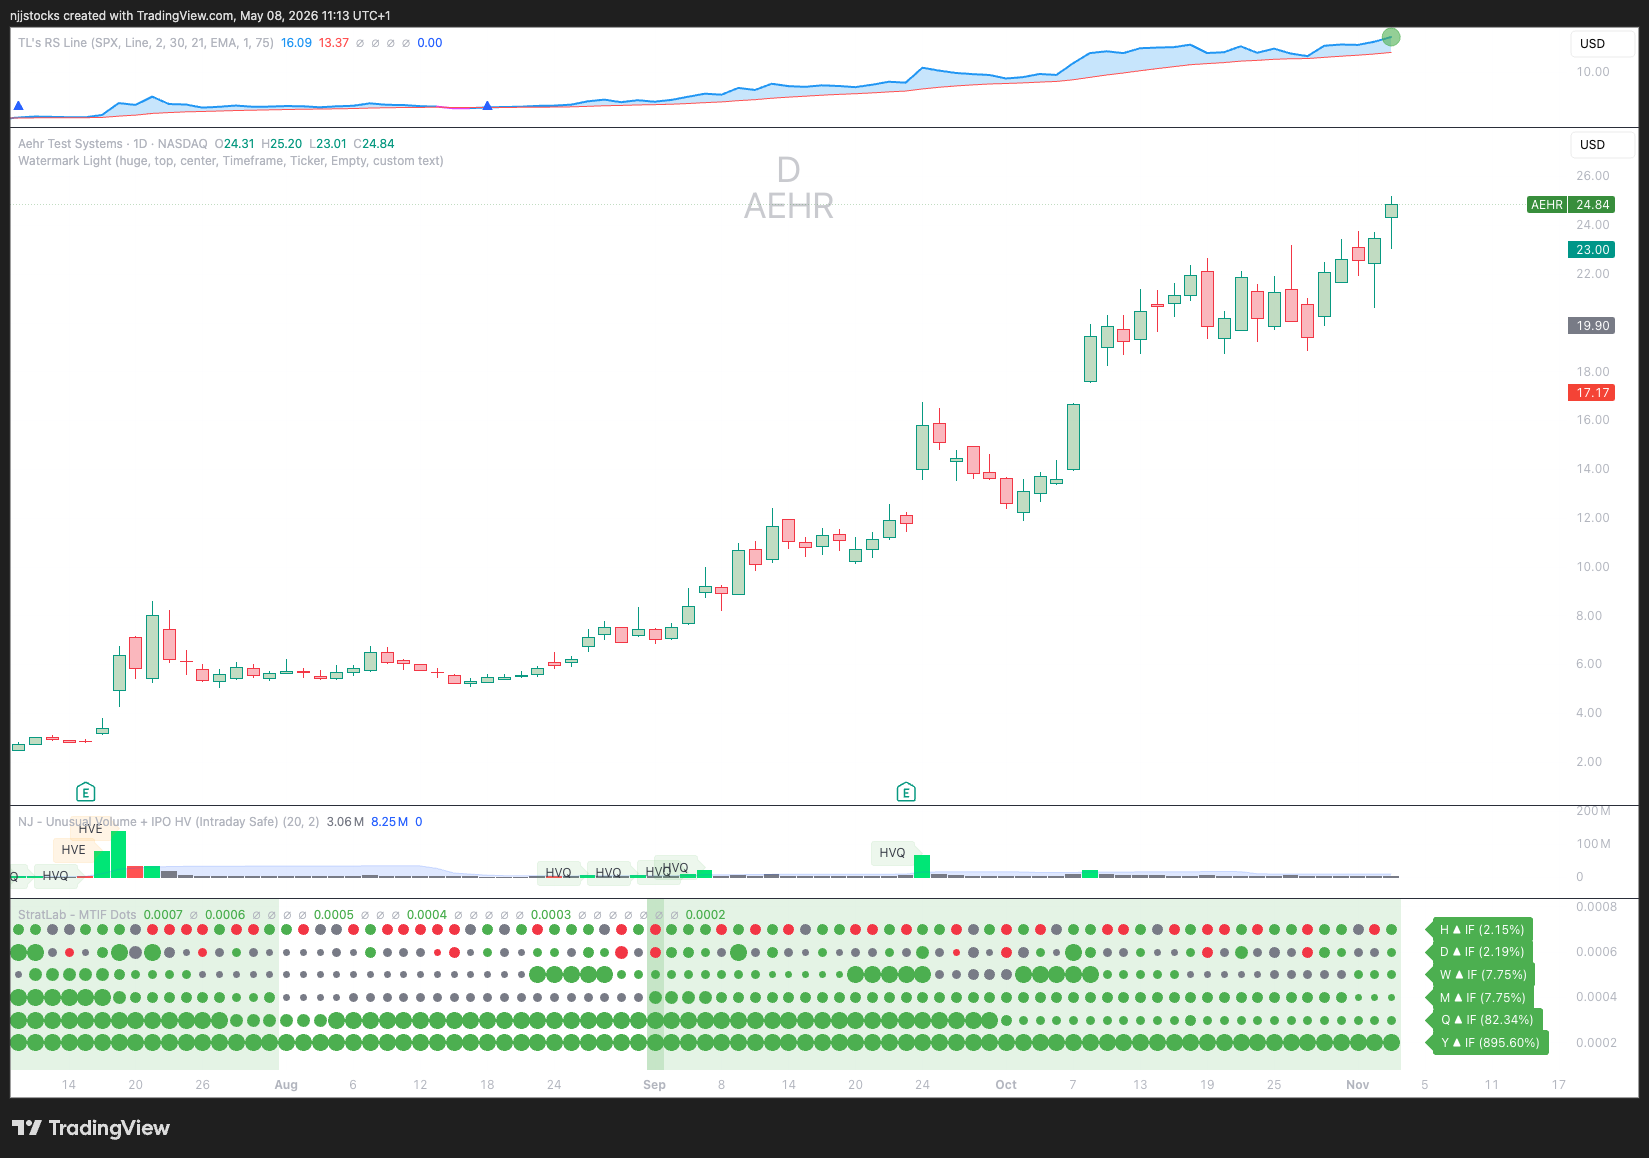
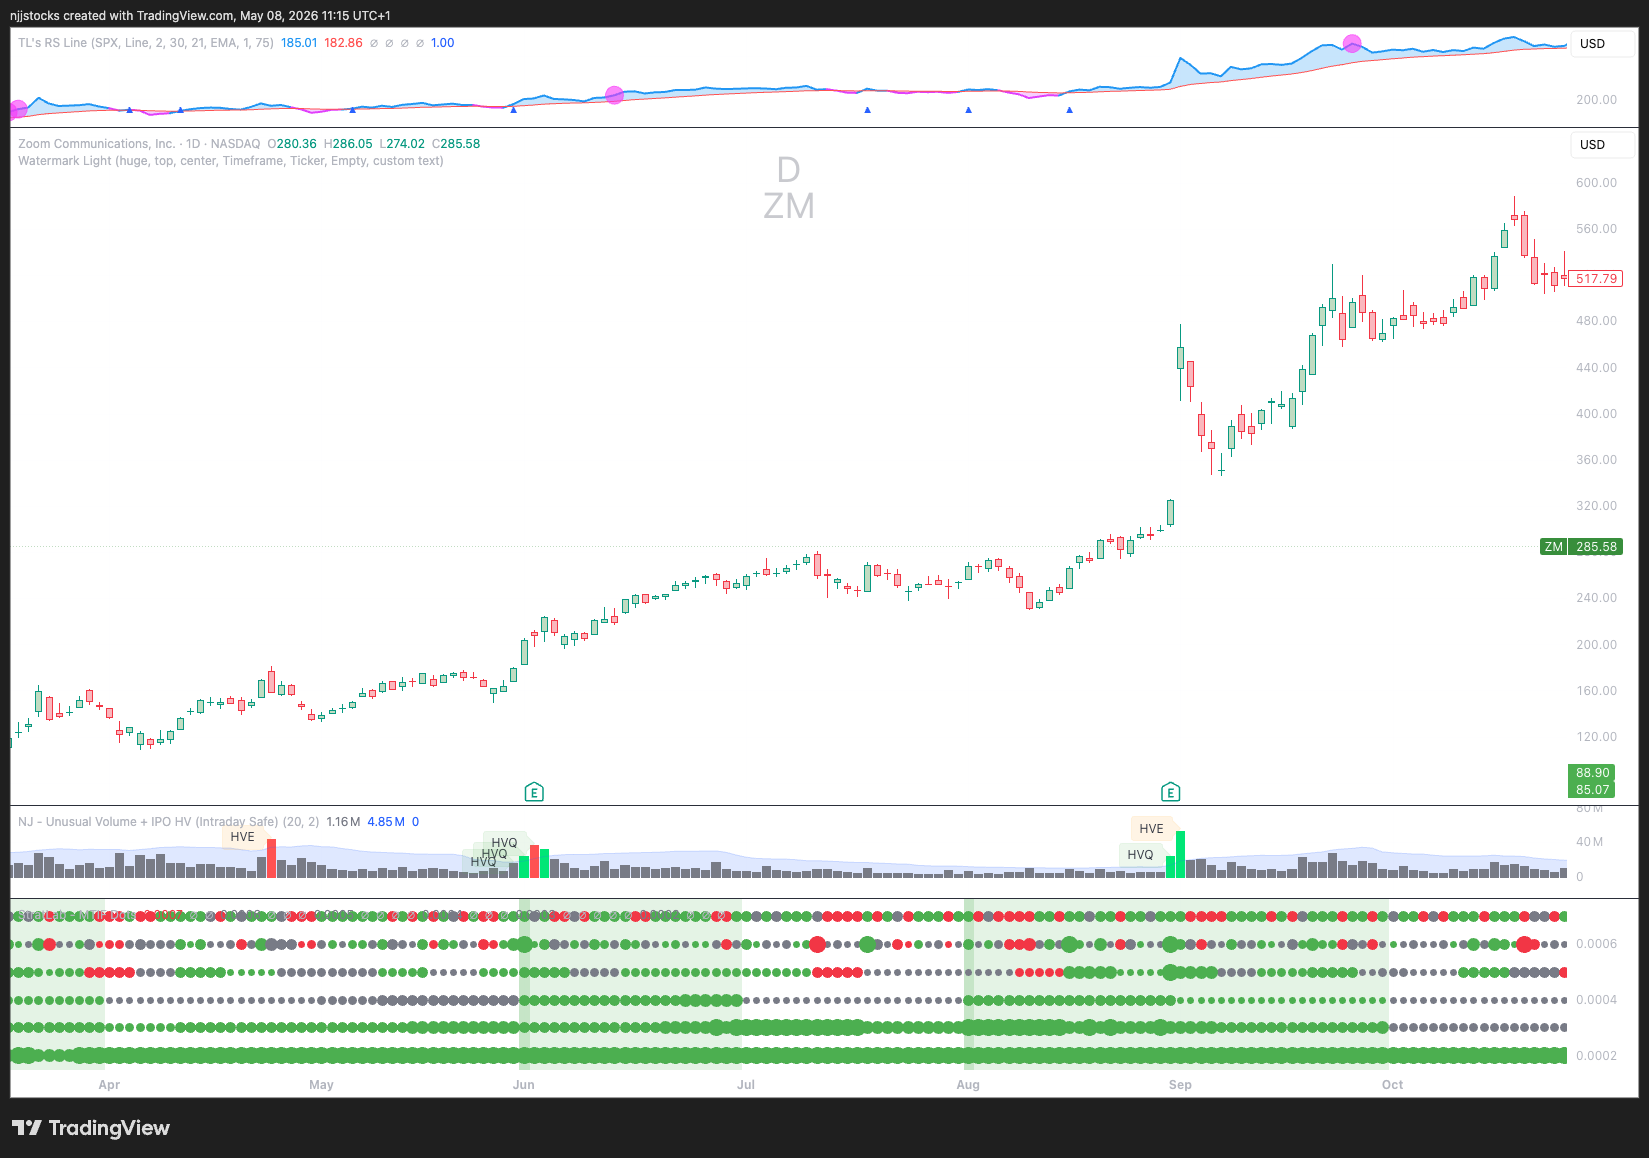
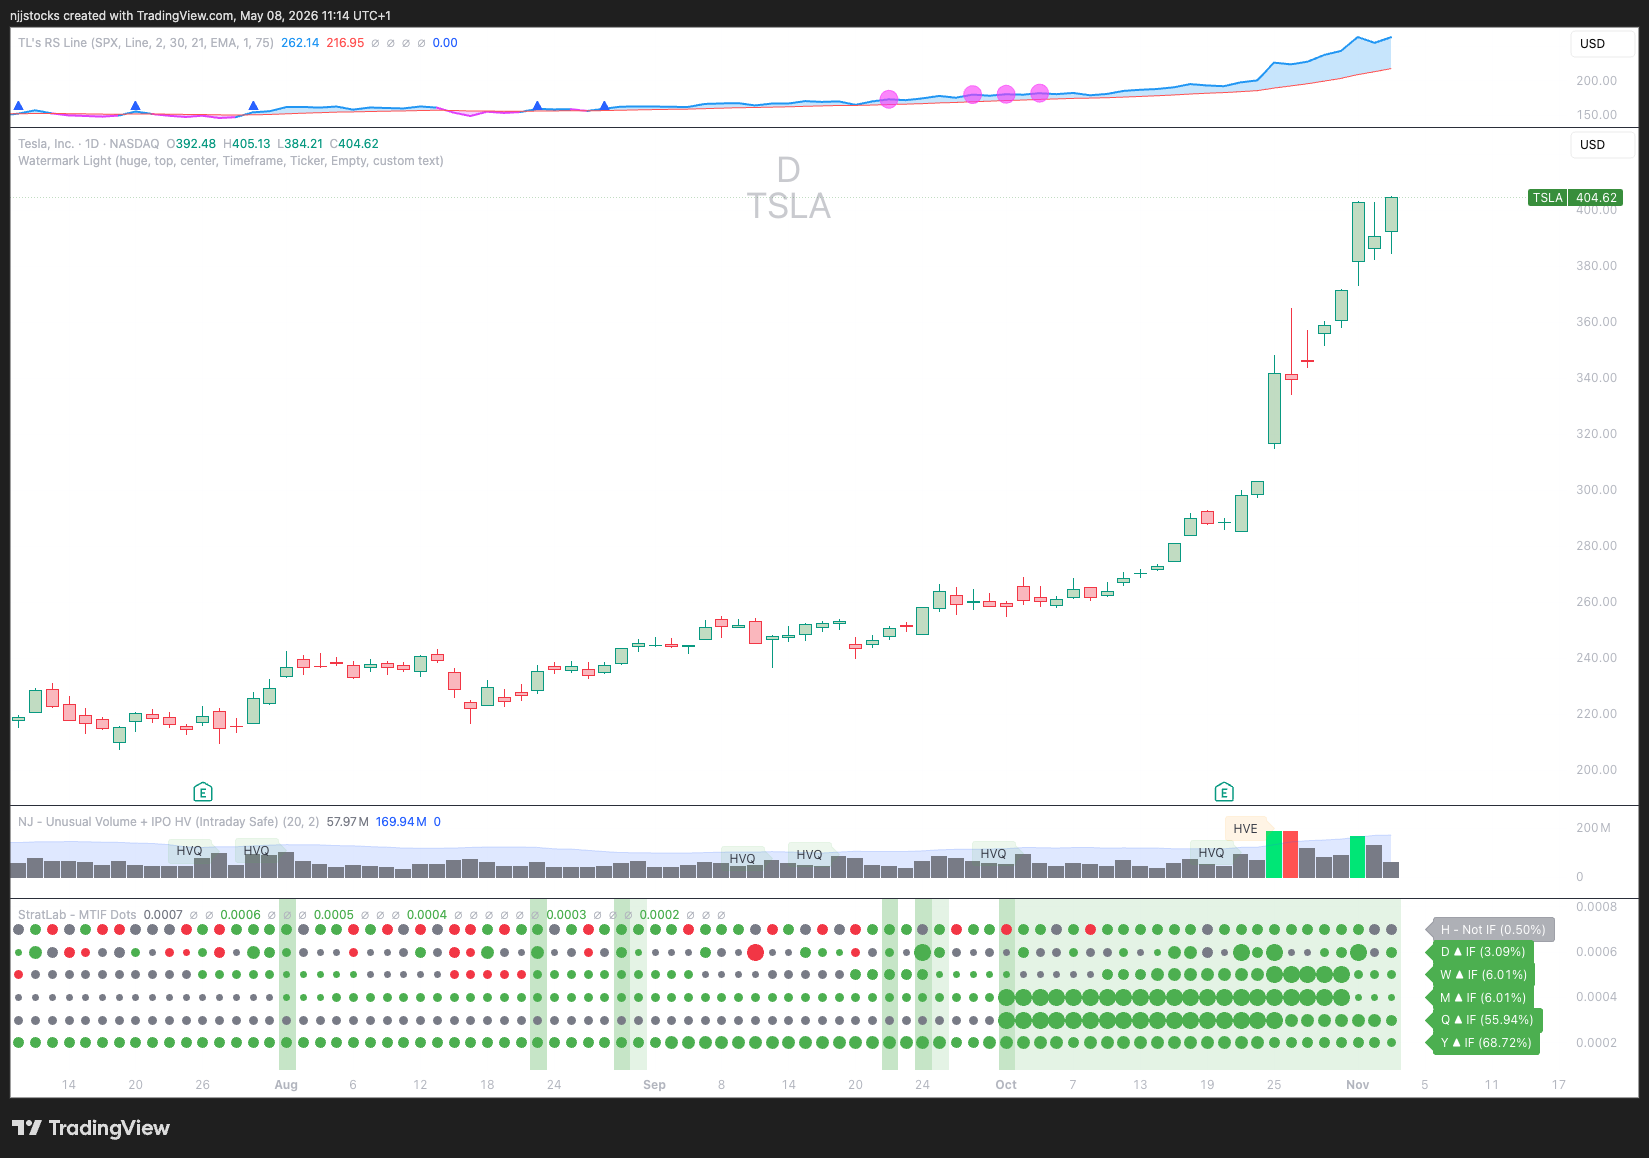
To get you started, here are a few examples straight from my own model book.
2025
2024
2023
2021
2020

Wrapping up…
Full Timeframe Continuity describes alignment.
In Force describes commitment.
Multi-Timeframe In Force describes the condition where commitment is stacked — where every level of the timeframe hierarchy has chosen a direction and the structure is loaded, waiting, before the move begins.
Every 300% move started with MTIF.
Thank you to Solanki — sometimes the best research begins with a simple conversation
Can TSLA do it again?
Amazing article! the indicator on the chart public ?