
What's the Next 2?
Why it is the only question that matters

In a previous post, I wrote about ‘reclaims’ and how understanding that one concept changed the way I read charts entirely. If you haven’t read it, go back and start there. This builds on it.
Because once reclaim clicked, something else unlocked.
I started hearing Rob’s question differently.
“What’s the next 2? What will it create, negate, or do?”
I’d heard it dozens of times. I could repeat it back to you on day one. But I wasn’t really using it. So the question isn’t whether the next directional candle is coming — it’s coming, it always comes. The question is: when it does, what will it create, negate, or do?
The question behind the question
When Rob asks what’s the next 2, what will it create, negate, or do, he’s not asking you to predict. He’s asking you to prepare.
Create — Would the next 2 set up a new signal on a higher timeframe? A new weekly reversal? A new monthly reclaim? A new continuation pattern? If yes, you have something worth paying attention to.
Negate or Reconfirm — Would it change continuity, or confirm that the current trend is intact? This is where reclaim lives. If price sweeps a level and the next 2 closes back above it, it negates the breakdown. If it can’t, the level has flipped.
Do — What job does this candle have to do? Take out a prior high? Reach the next target? Fill a gap? If the candle has no job, there’s no trade.
Why this post exists
A shout-out to Vanille, who posted this question in a forum:
“I’m scanning for a 2dG daily candle. Give me a detailed checklist of what to consider before buying — using daily, weekly, and monthly context. Take into account create, negate, or do.”
It’s a great question. But what I realised writing the answer is that the 2dG checklist is just one application of the bigger question. The real skill isn’t memorising a checklist for each candle type. It’s developing the habit of asking — before every single trade — what’s the next 2, and what will it create, negate, or do.
The checklist is the scaffolding. The question is the building.
The checklist
Before acting on any 2dG daily candle, you’re really just asking the same three questions with more granularity.
Start with the monthly:
Is price at a monthly support or resistance level?
Would the next 2 create a new monthly signal?
Is there room to the next monthly target, or are you buying into a ceiling?
Is the monthly candle trying to reclaim a prior high or low, or just bouncing mid-range?
Then drop to the weekly:
Is the weekly trend still intact, or already weak?
Would this daily candle create a weekly setup?
Does it reclaim a prior weekly high or low?
Is there enough room to the next weekly target before you hit resistance or supply?
Then judge the daily candle itself:
Is the 2dG happening at a good location?
Is it coming off a clear level — prior low, support, gap, 21 EMA/50SMA, prior breakout area?
Did it close strong, near the highs?
Did it reclaim the prior day’s high or close?
Is there a clean invalidation level?
Is this a real reversal candle, or just a weak bounce inside a down move?
The rule: I only buy it if it creates value on the higher timeframe, does not negate the bigger trend, and has enough room to do the next job. If it’s mid-range, extended, or buying into resistance — I pass.
Example 1: $ACIW
Let’s run the framework on a real name from the scan right now.
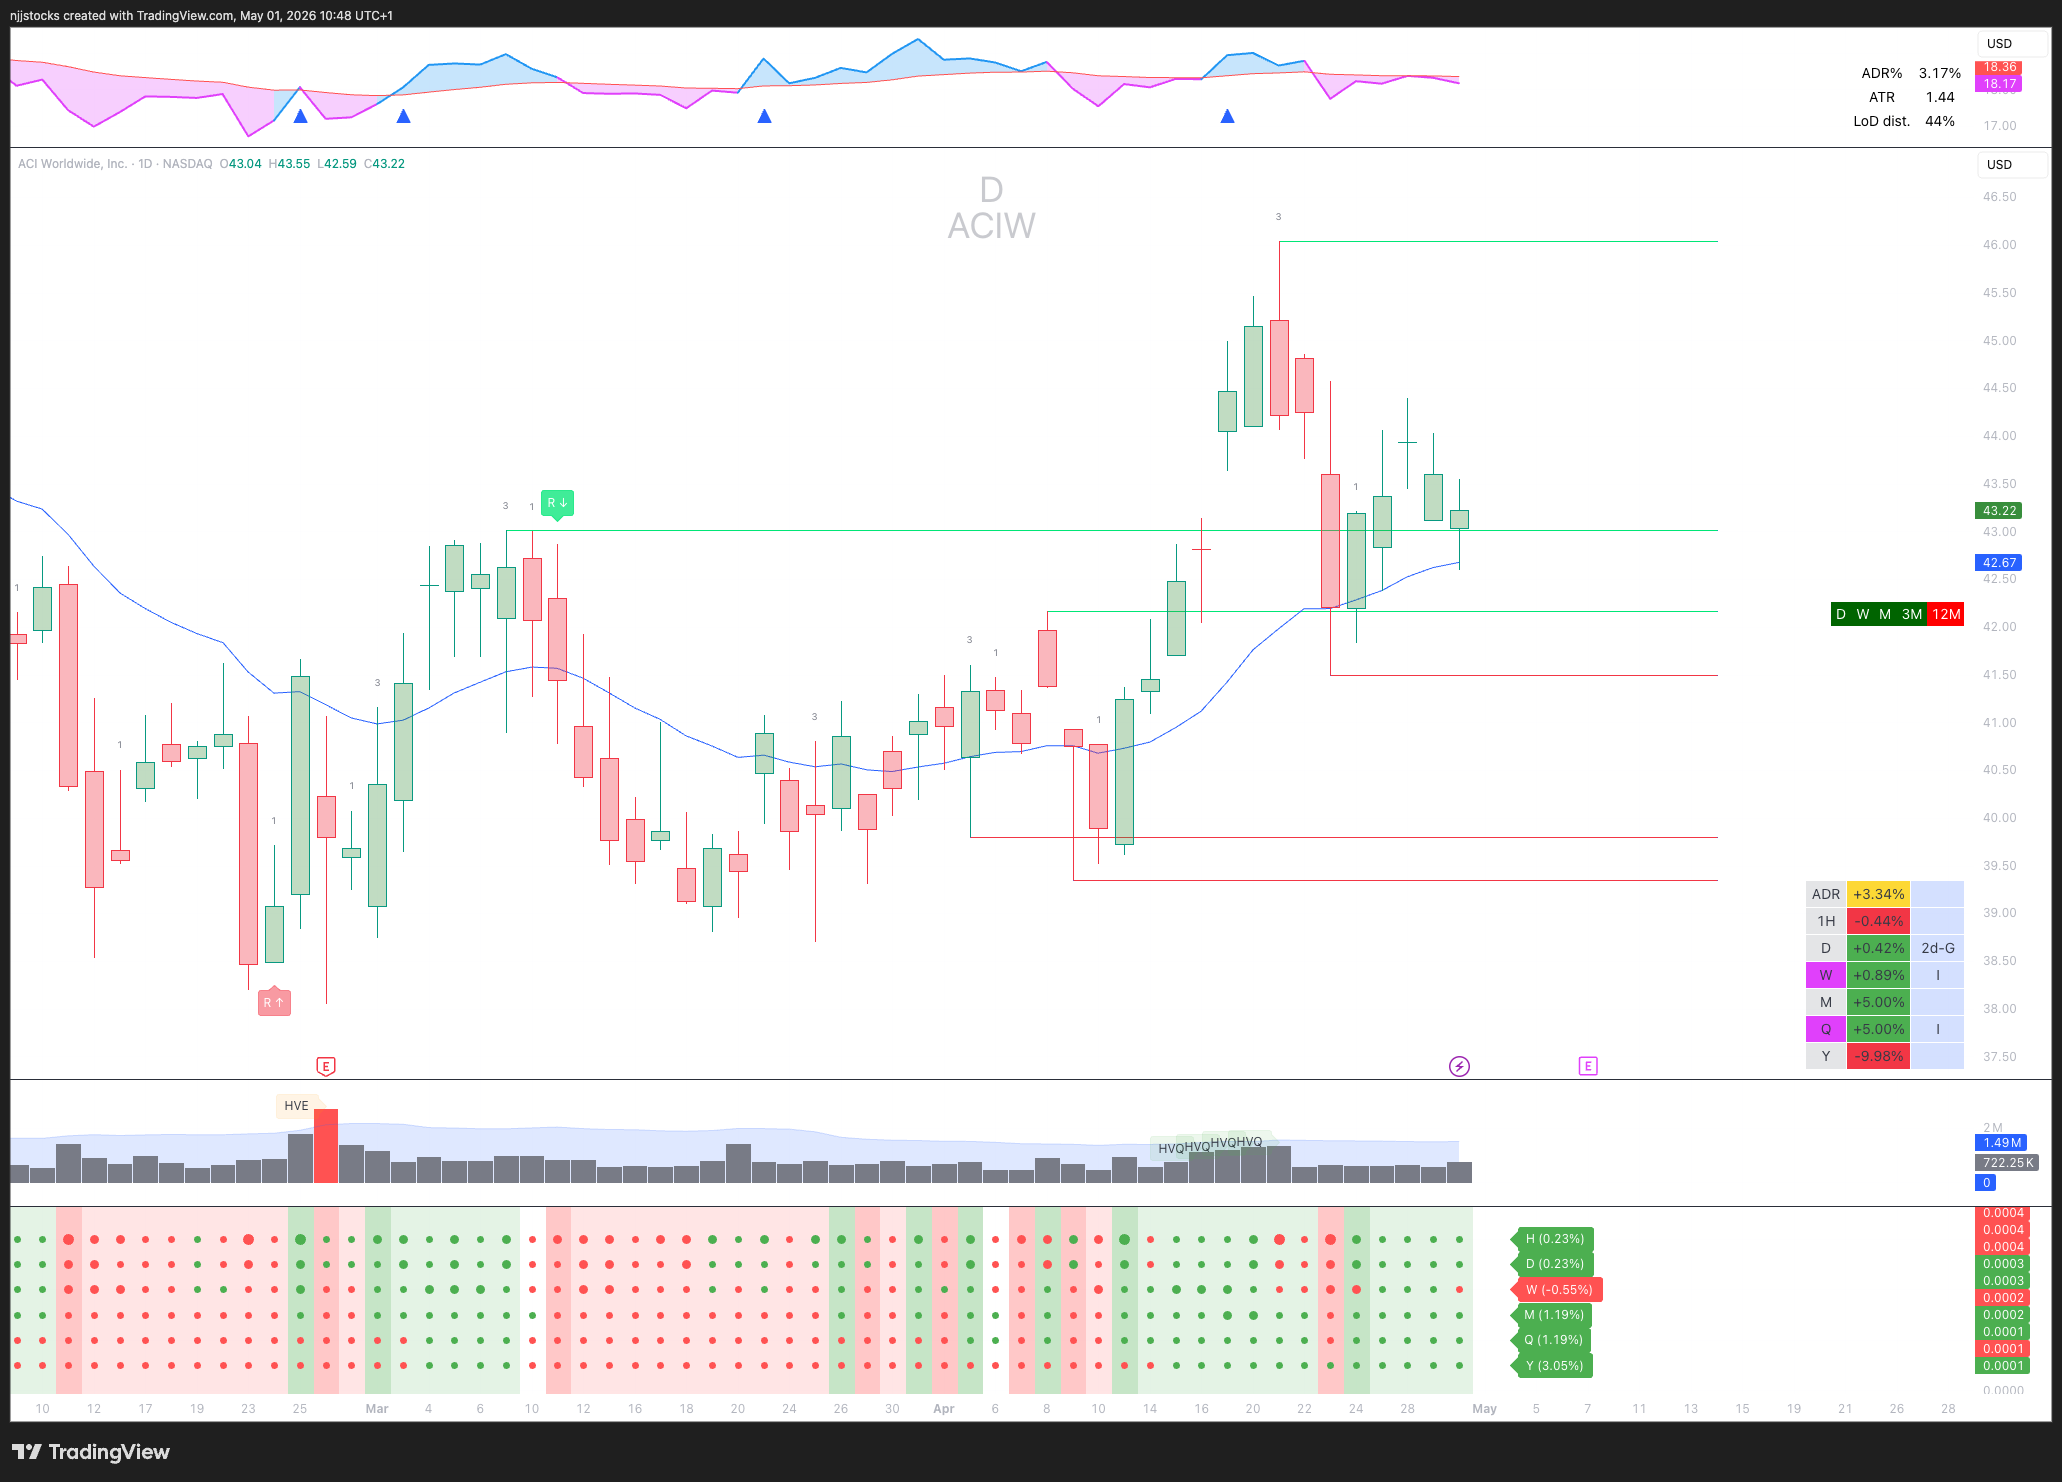
On the daily, price is printing a 2dG. It’s sitting just above a key reclaim level around 43.01, holding above the 21 EMA which is beginning to curl upward after the sell-off from the 46+ area. The compression near this level after the flush is constructive — buyers are defending.
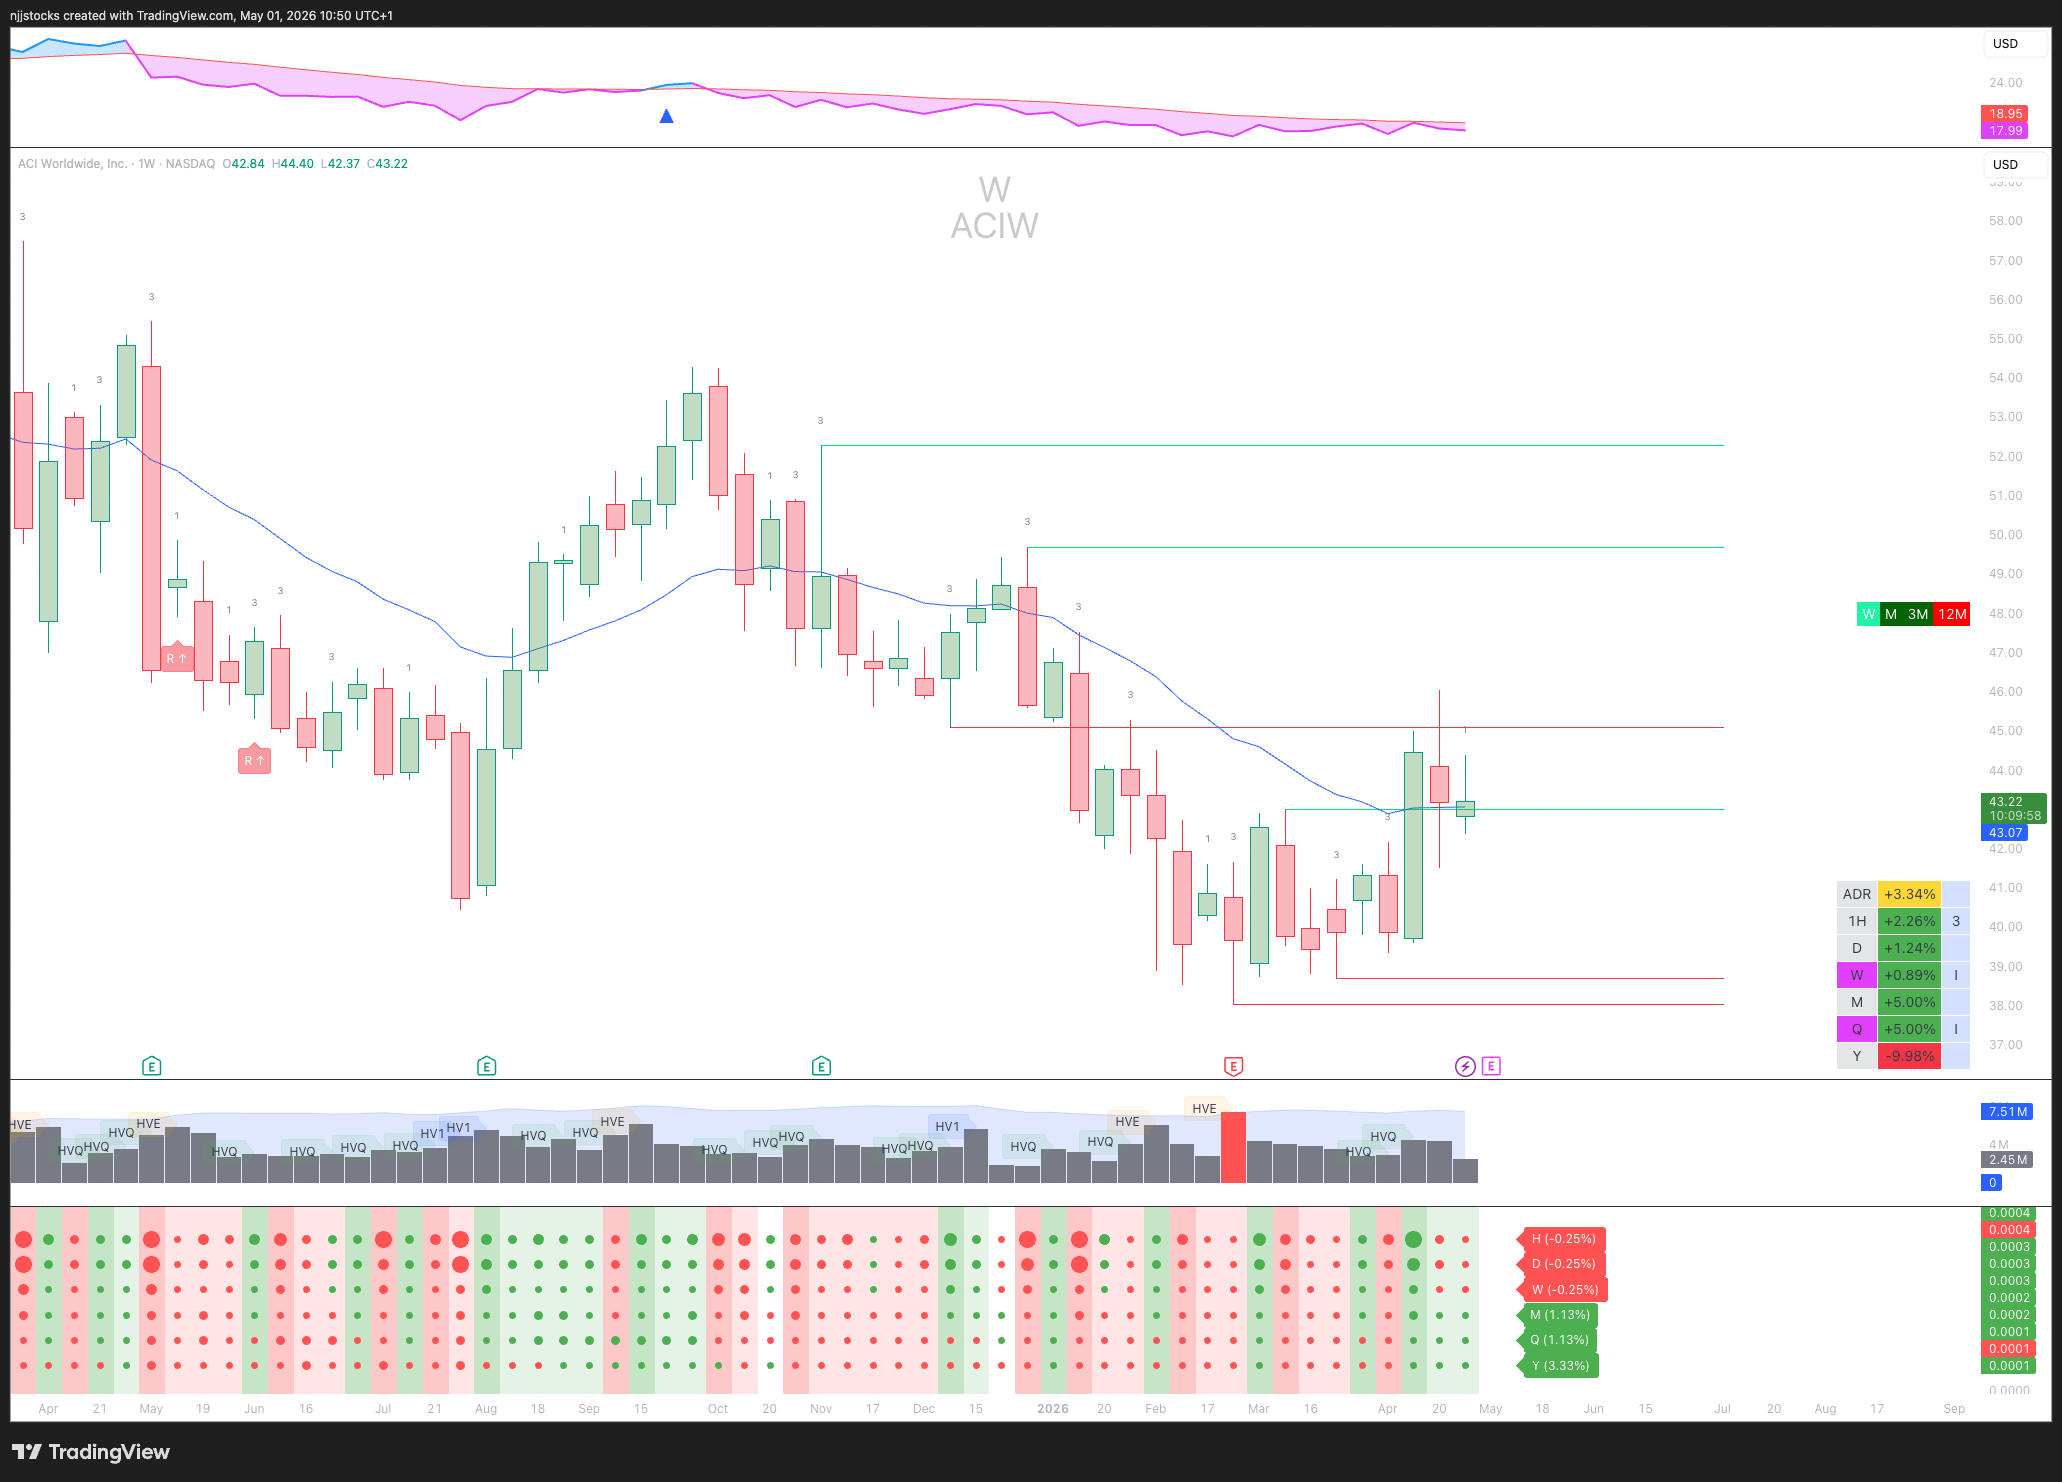
On the weekly, price came down hard from the 50-53 range, made a series of lower lows into the 38-39 area, and has since pushed back. The current weekly candle is an inside — still digesting, not yet in force.
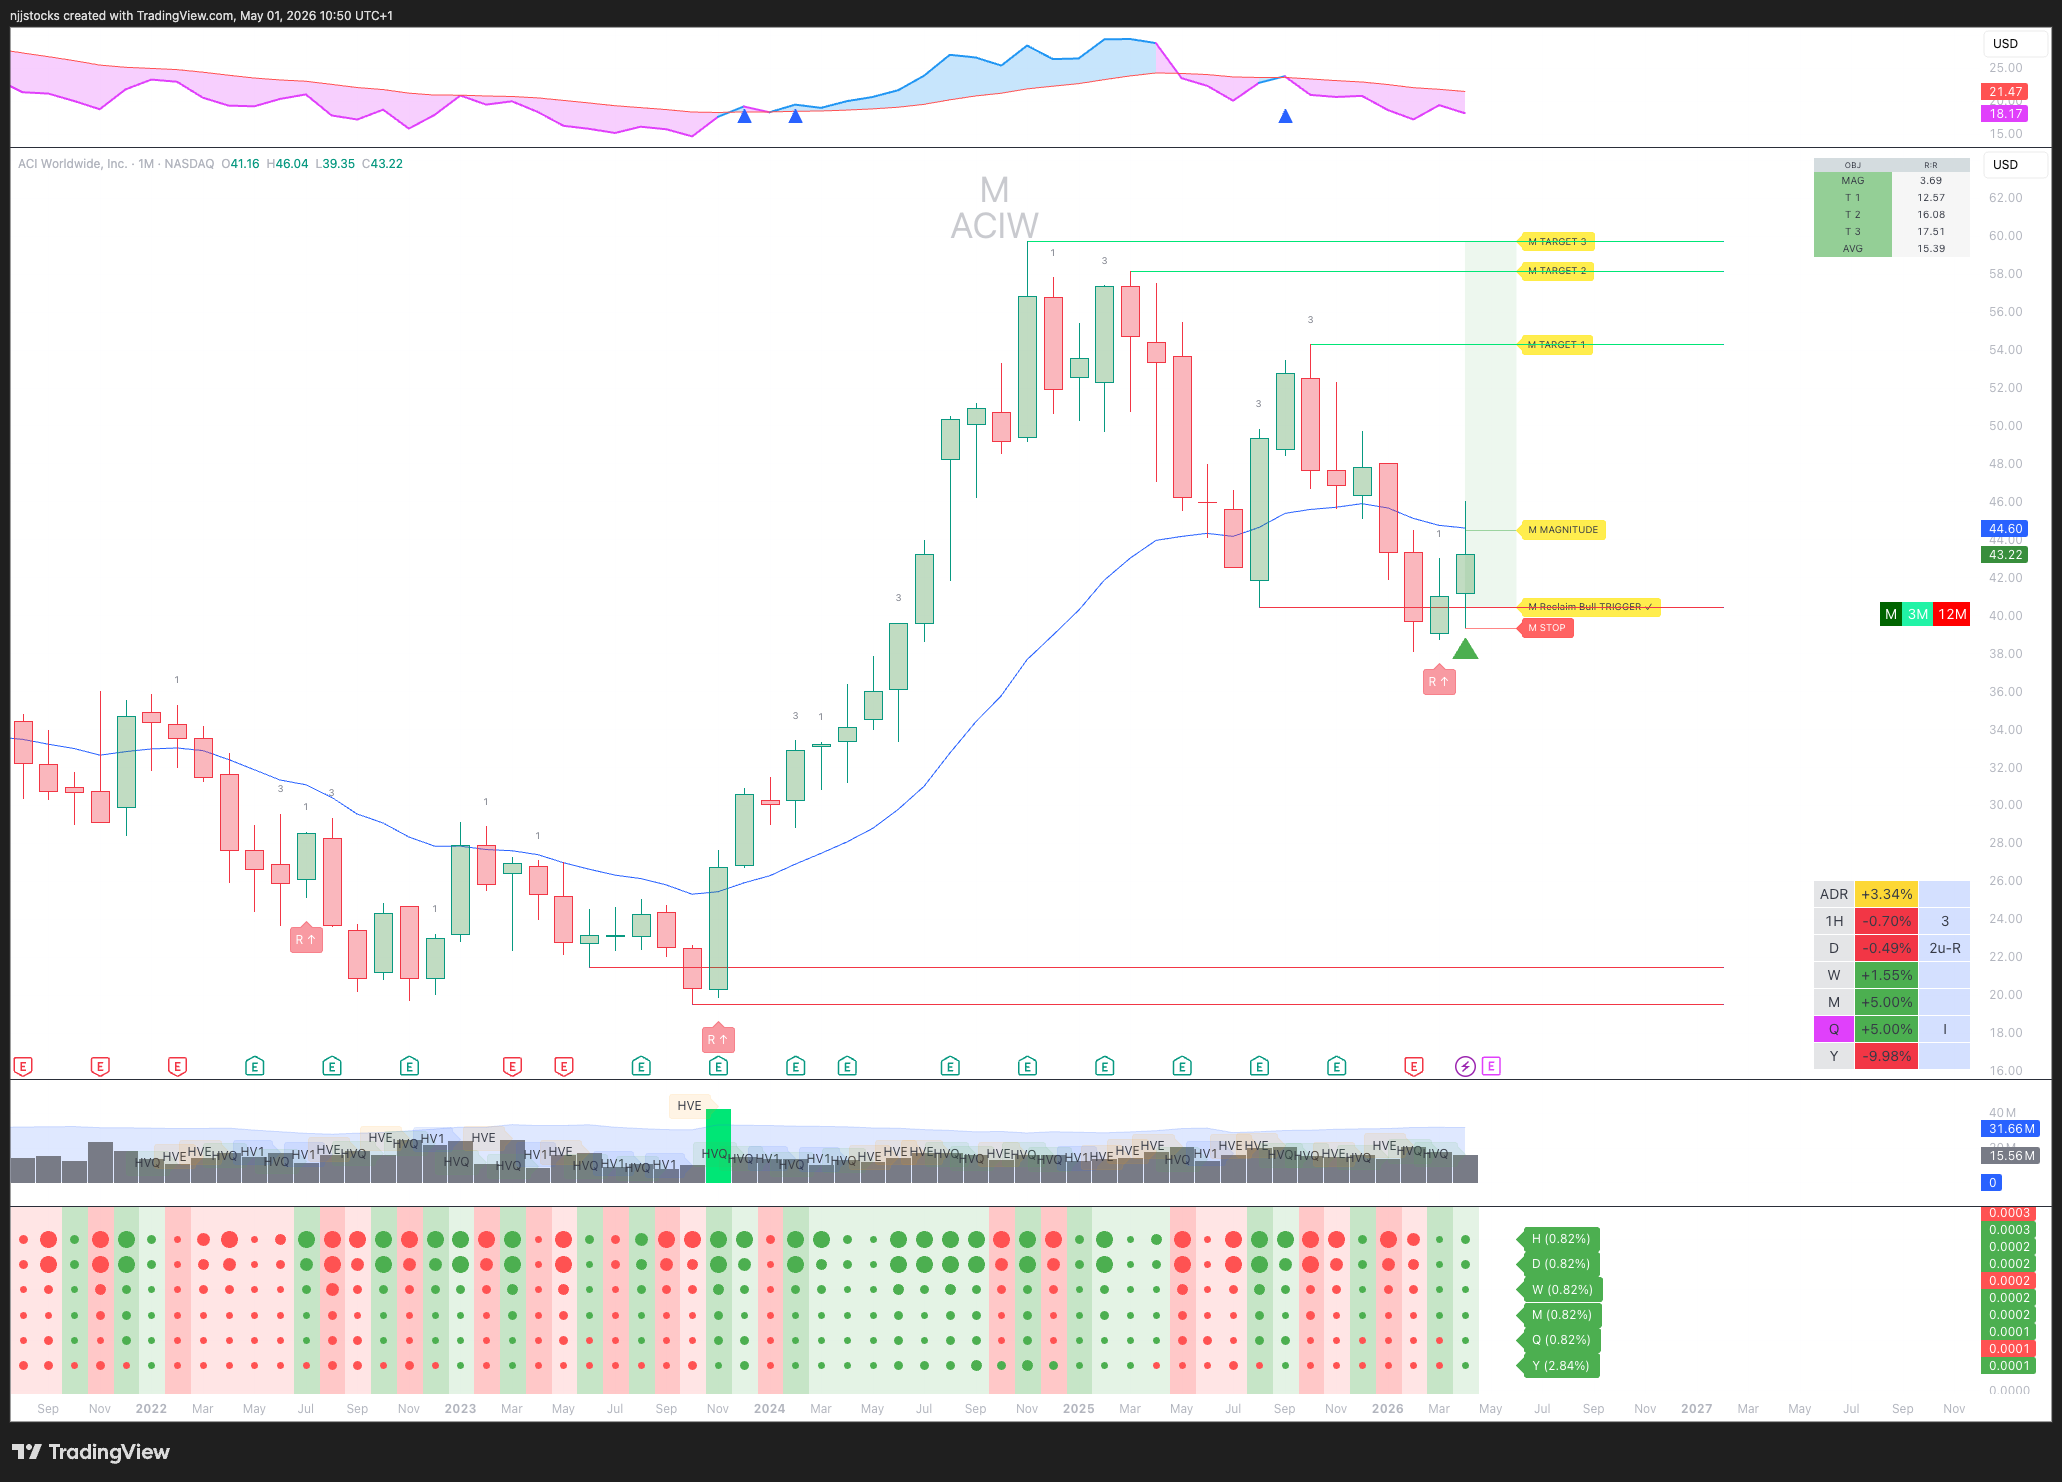
The monthly is where the conviction is. We’ve got a 2d-1-2u reversal on the monthly with three clean targets stacked above price — M Target 1 at 55.07, M Target 2 at 58.55, M Target 3 at 60.00. Price is sitting inforce and that’s our line in the sand.
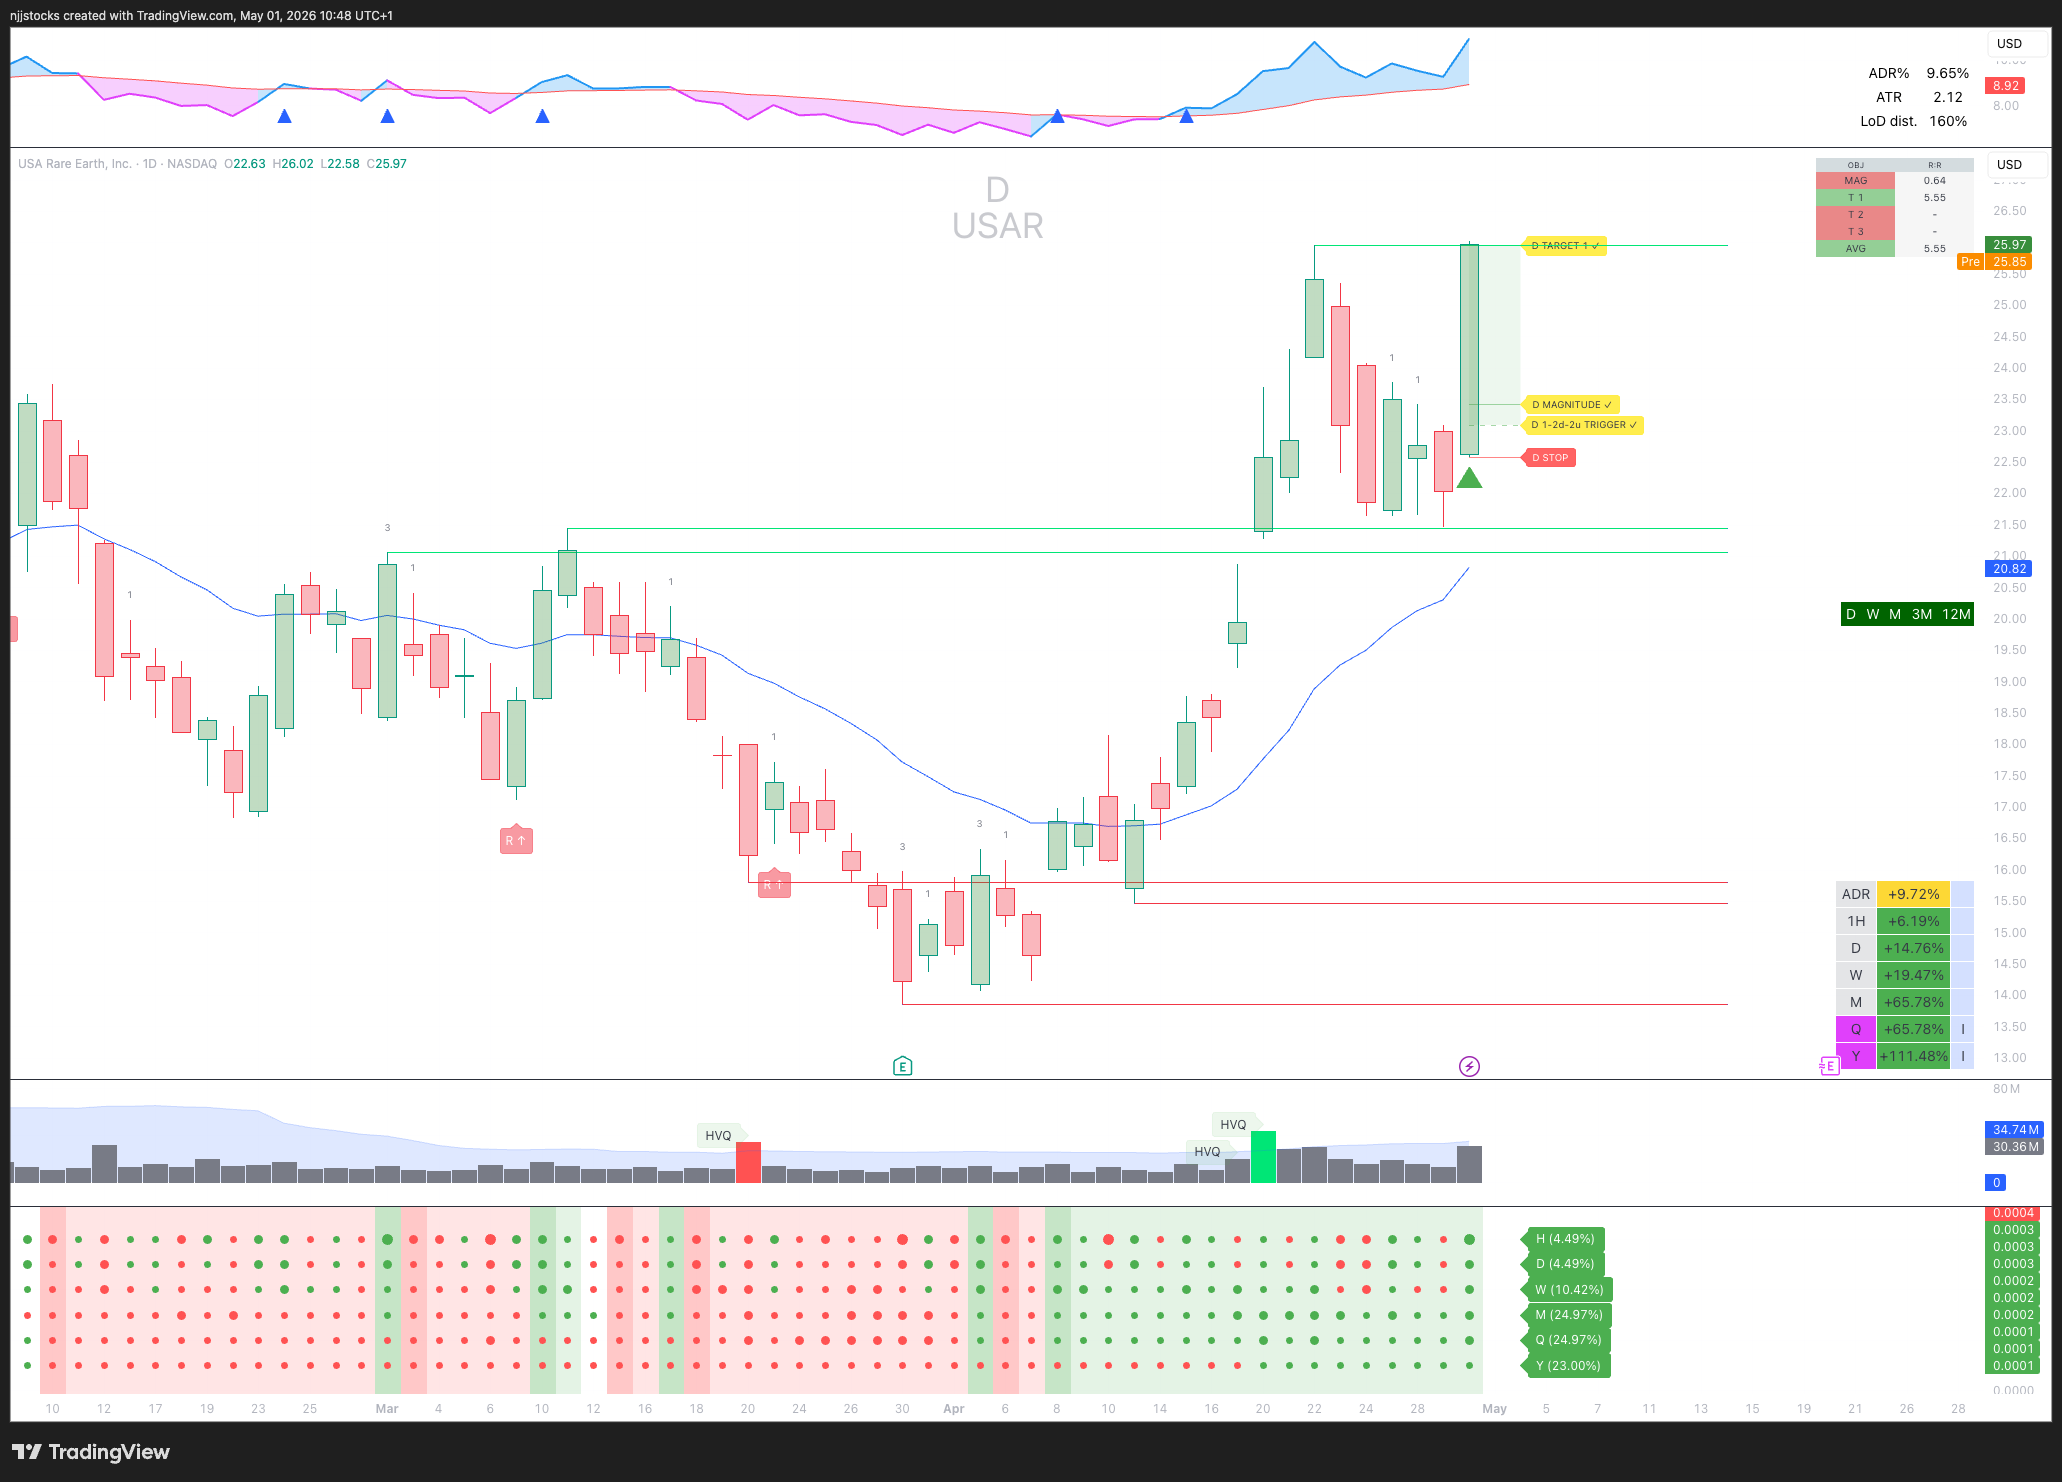
Now let’s walk through a potential scenario. If price opens above yesterday’s high, the daily goes in force — and that puts a PMG on the table, similar to what $USAR did recently.
Then next week, if price takes out the current weekly high at 46.04, the weekly goes in force too. Add in the new month just starting, and suddenly the monthly can come into play as well.
Now ask the question:
Create? A daily close above 43.55 creates a daily signal in force. If the weekly then takes out 46.04, the weekly goes in force too. With a new month just starting, all three timeframes could begin stacking in the same direction quickly.
Negate or Reconfirm? Reconfirms — monthly continuity holds as long as price defends above the bull trigger zone.
Do? Clear room to M Target 1 at 55.07. That’s roughly 25% from current levels with stacked pivots and a clean path.
Invalidation is simple: a daily close below the 41.16 monthly open puts the thesis on hold. Until then, this stays on the watchlist.
That’s the kind of alignment I’m looking for. Multiple higher timeframes beginning to confirm in the same direction, one candle at a time.
Example 2: $GTLB
This one has several signals stacked cleanly across multiple timeframes. A 2-down green on the daily. A 2-down on the monthly. A 2-down on the quarterly. The pivots and upside targets are sitting above price, giving the trade room to expand.
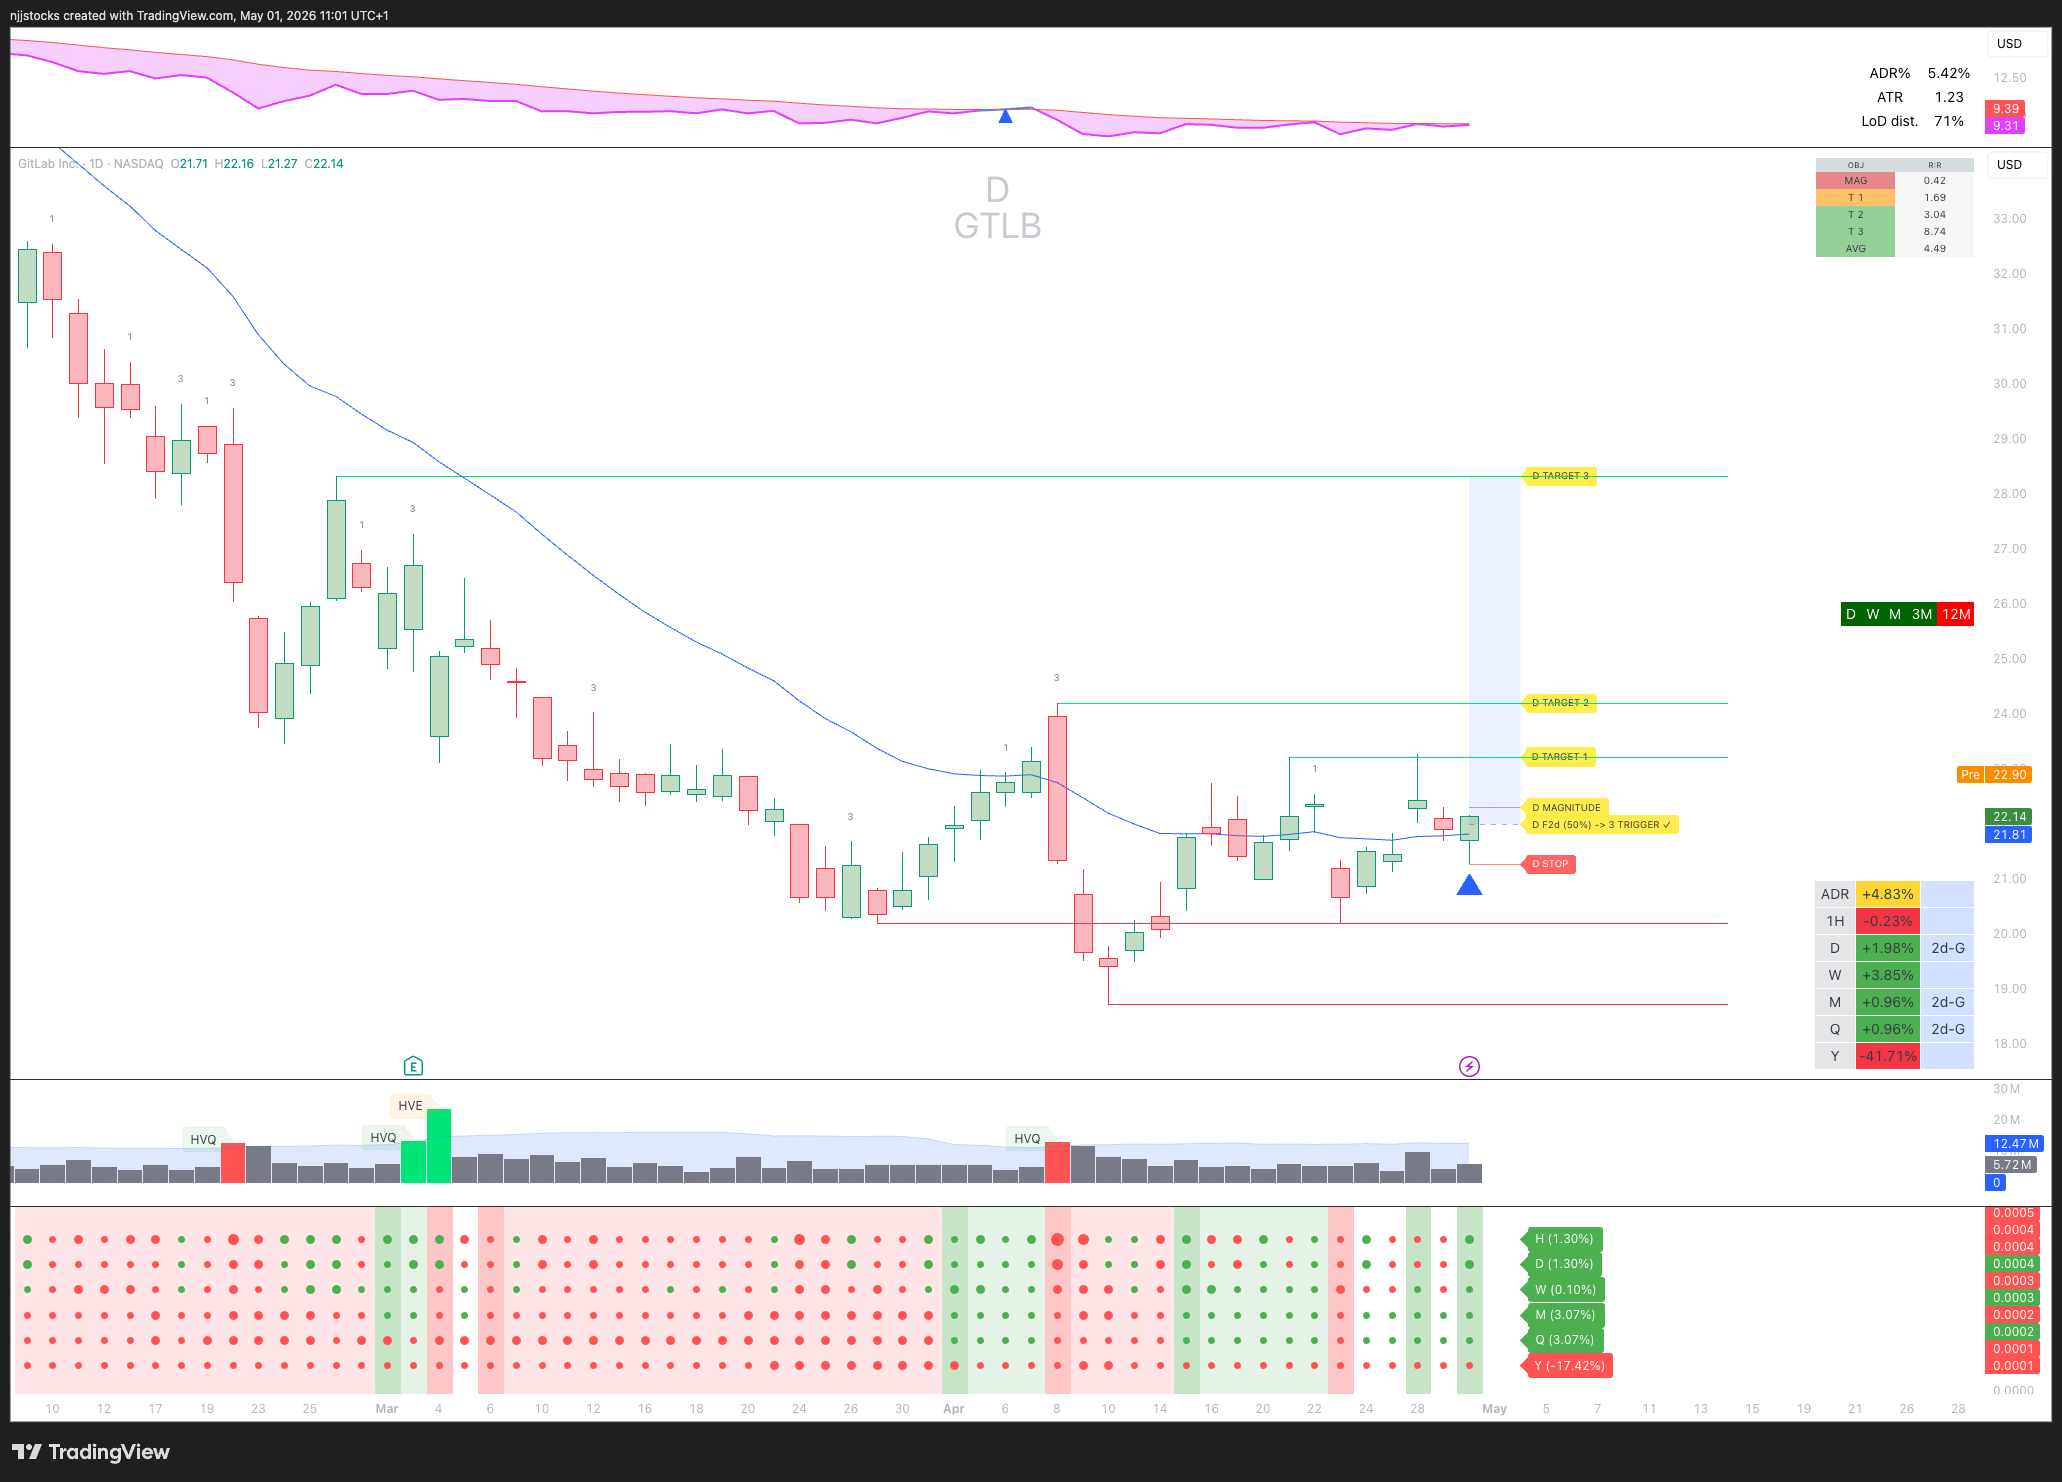
What adds even more conviction is sector strength. The broader software sector — $IGV — is also moving aggressively higher.
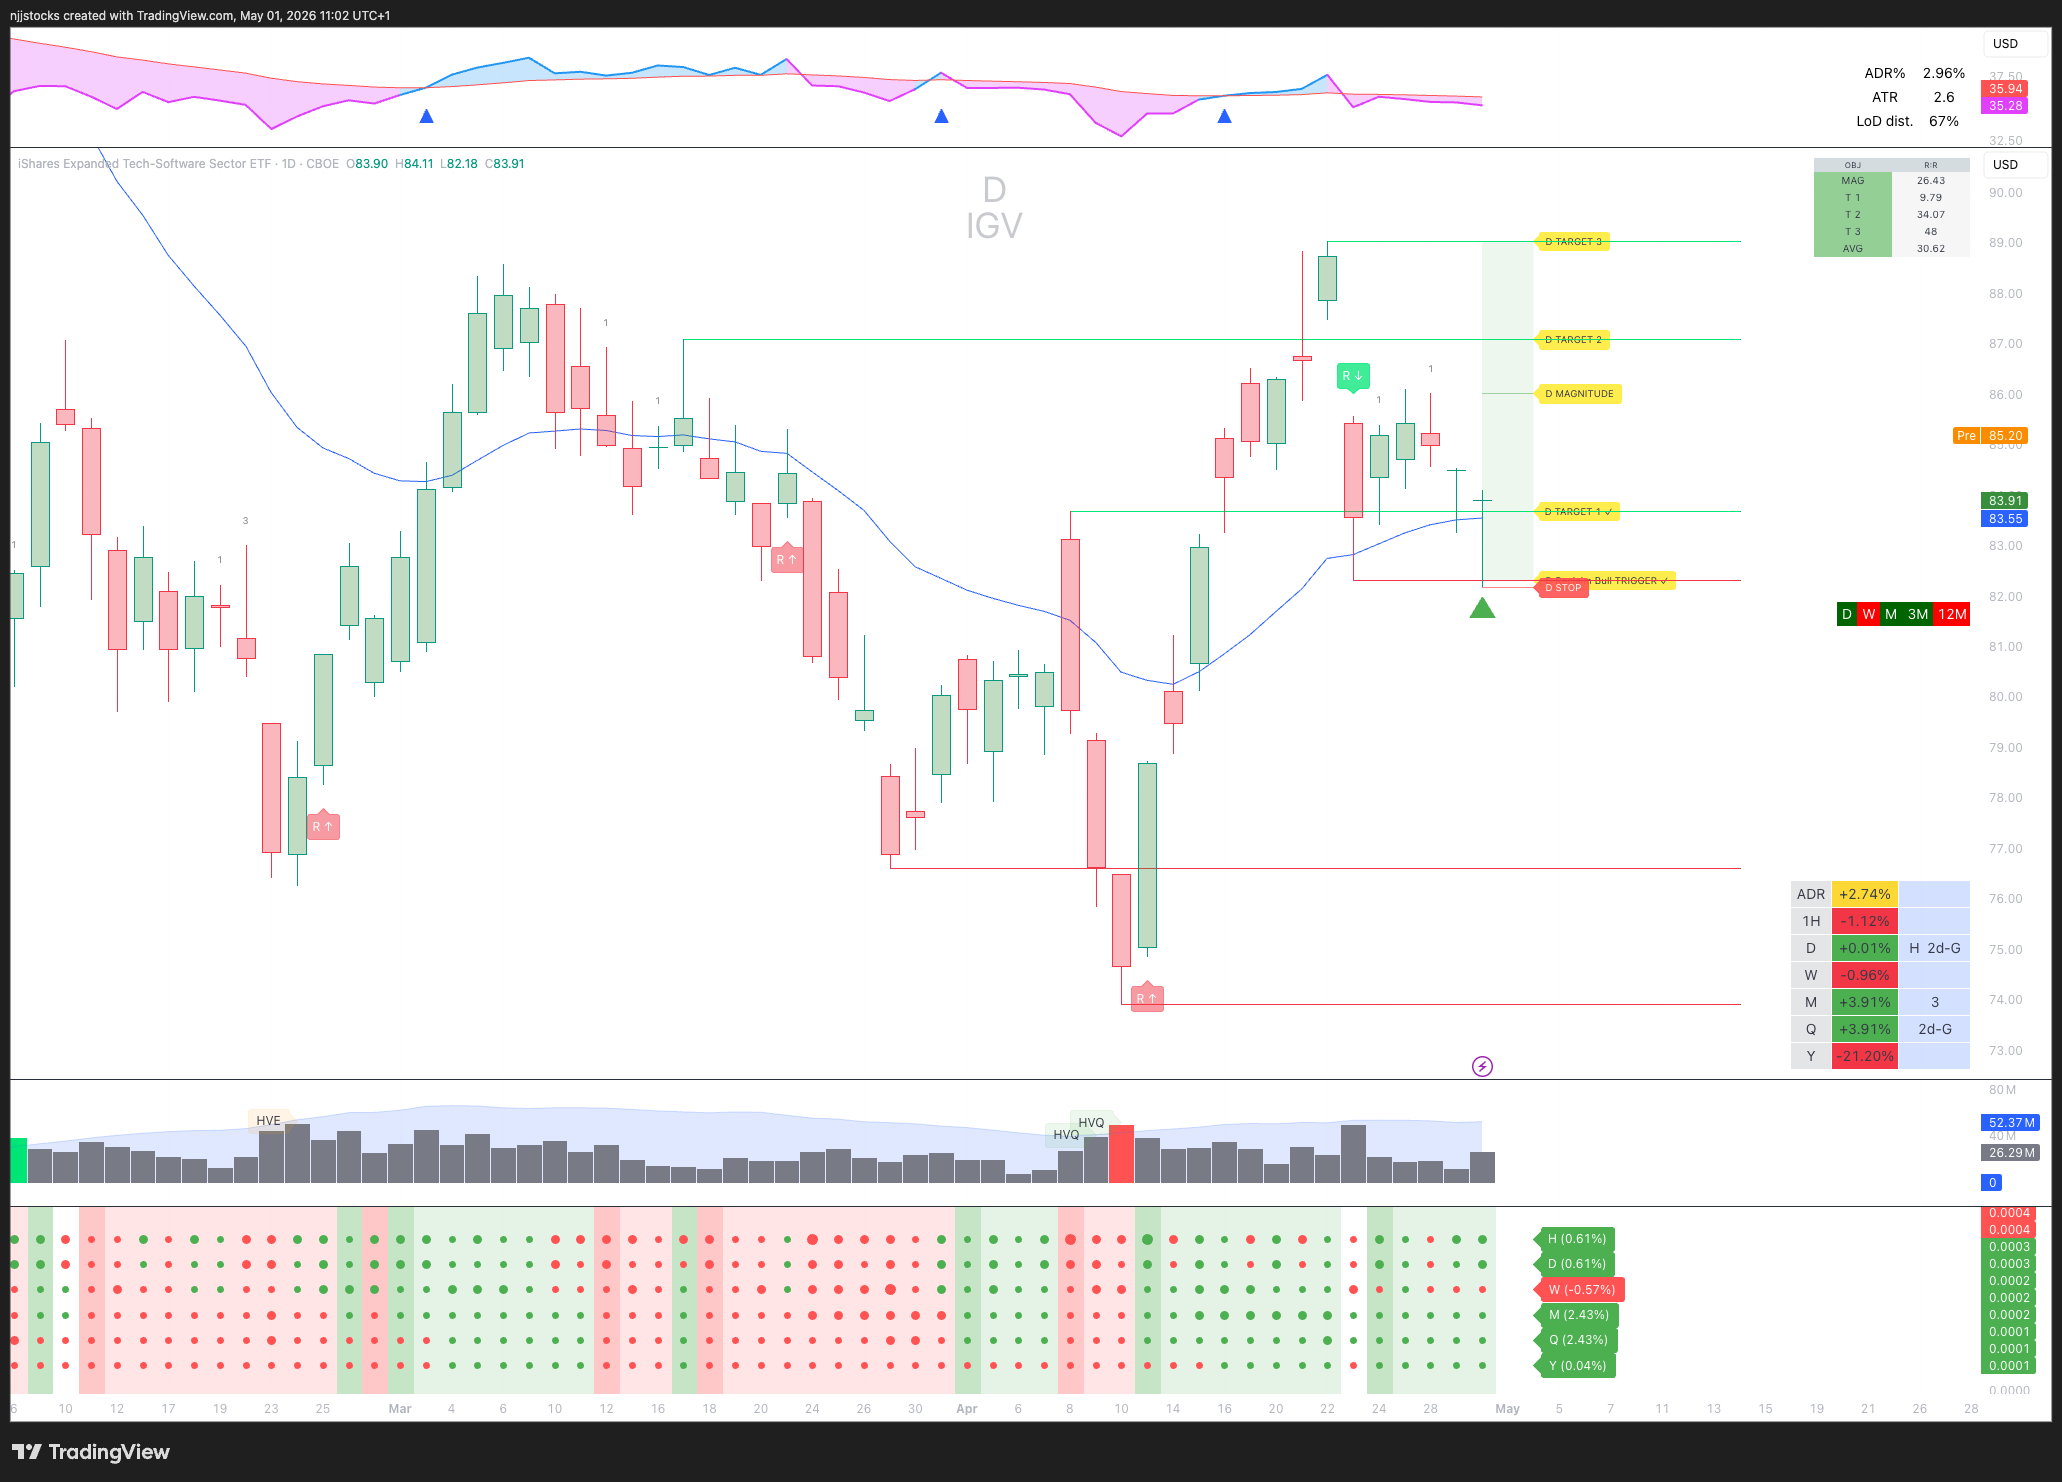
The daily is printing a 2-down hammer. The monthly is a 3-up. The quarterly is also a 2-down.
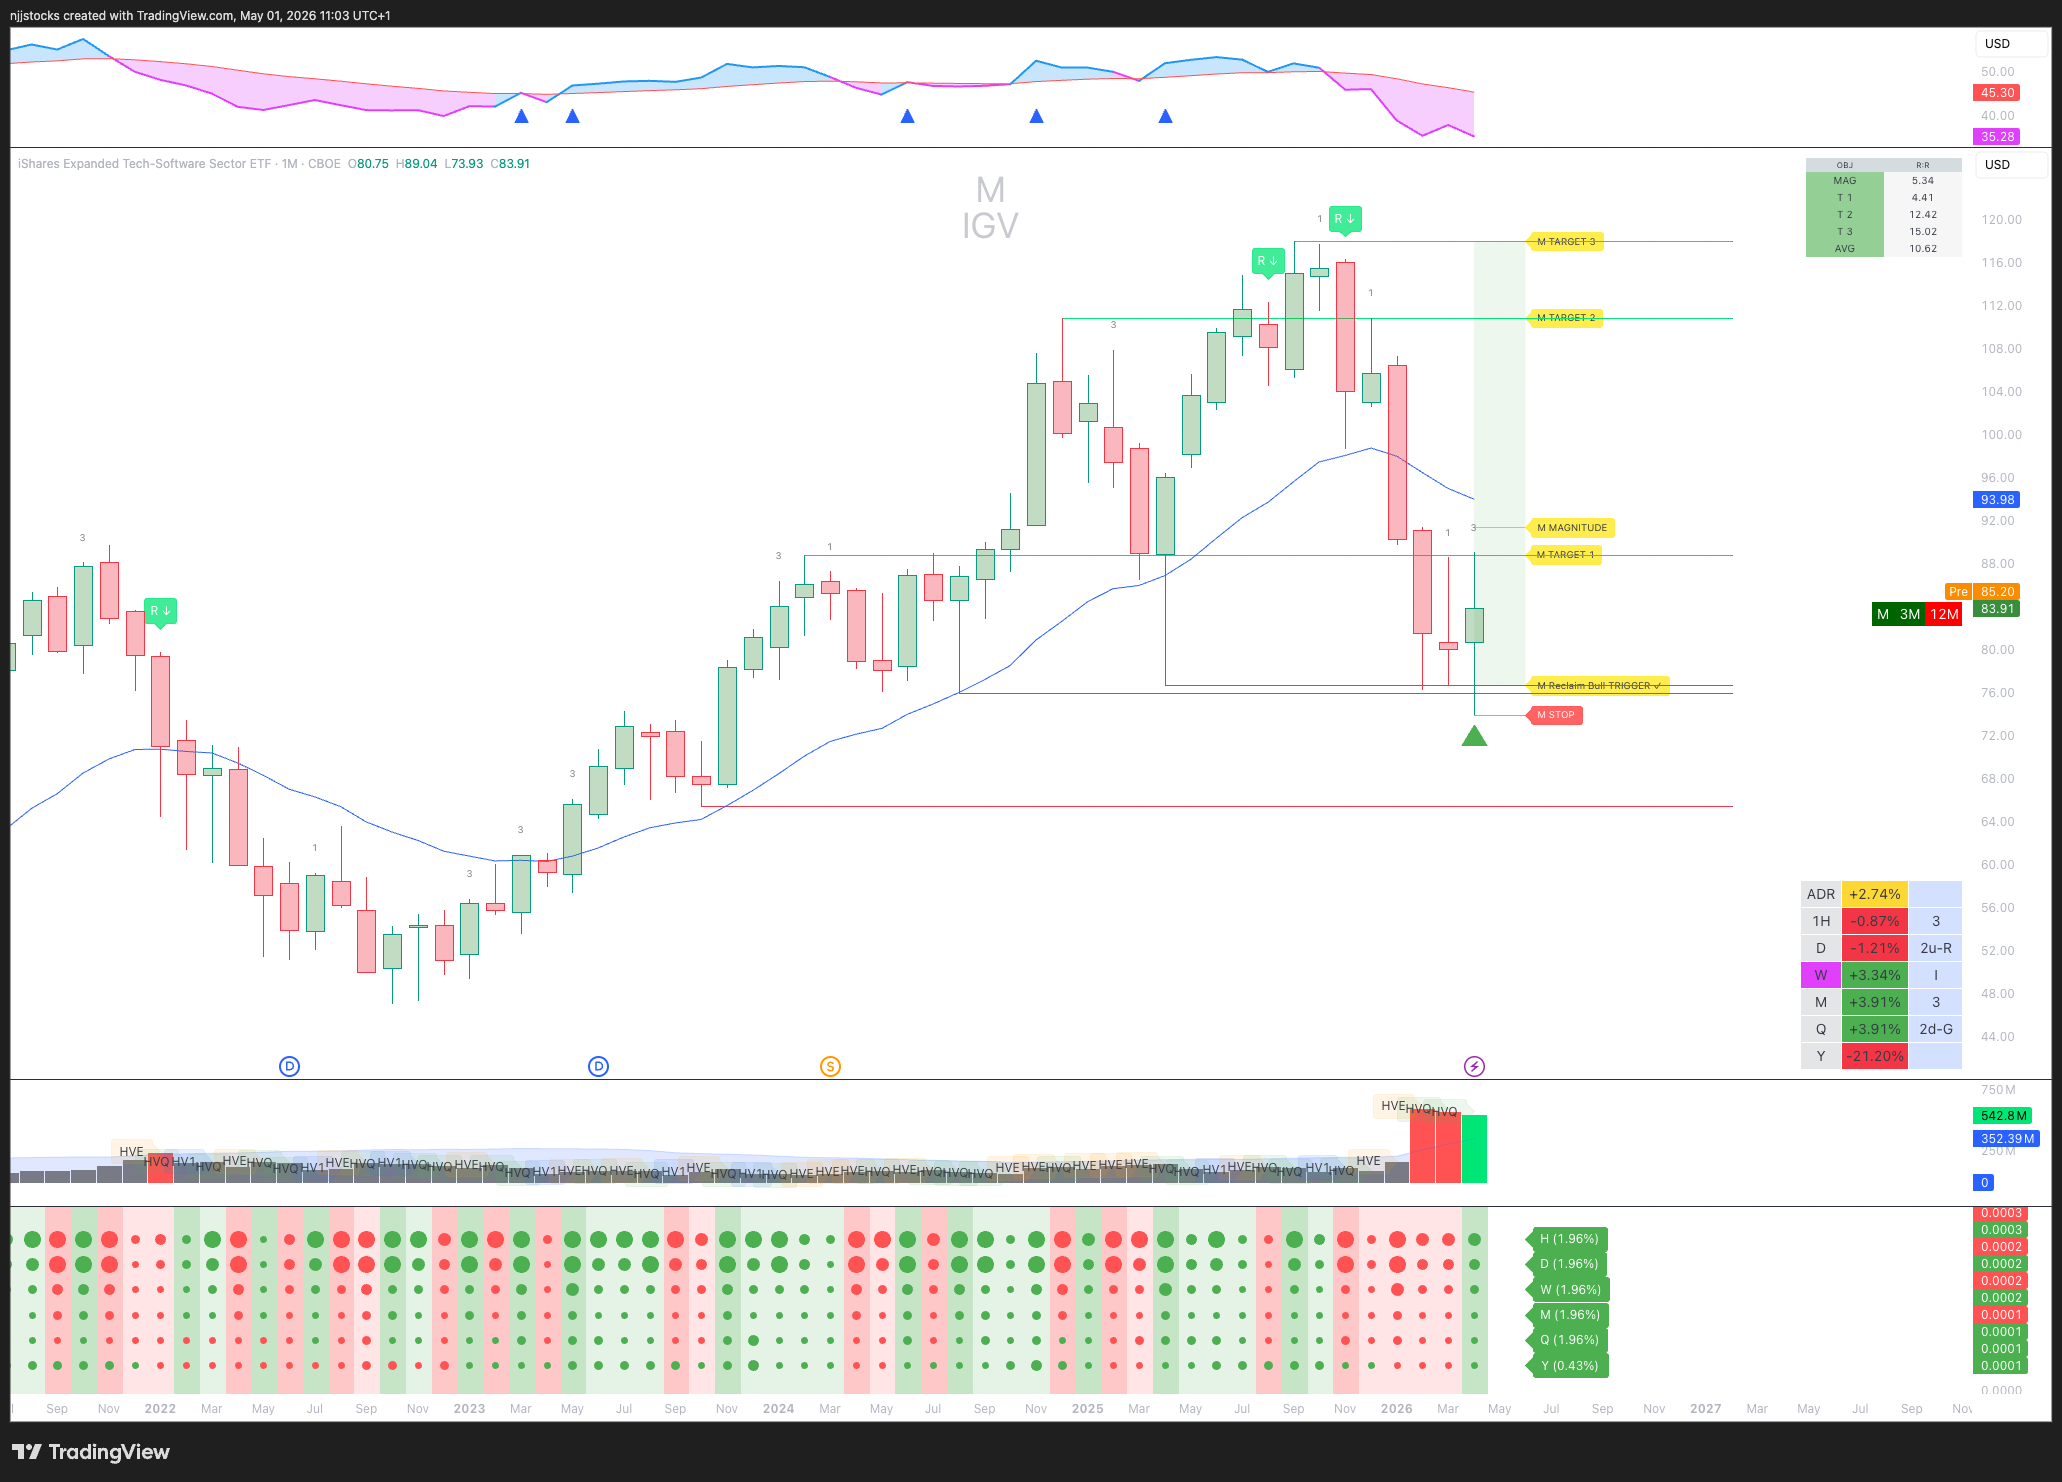
This is exactly what we mean by stacking the odds in our favour. When both the individual stock and the sector are aligned across multiple timeframes, those are the names that tend to participate most strongly if the move continues.
Example 3: $RBRK
Similar setup to $GTLB on the surface. Daily, monthly and quarterly charts are all printing 2-down signals. The pivots are stacked to the upside.
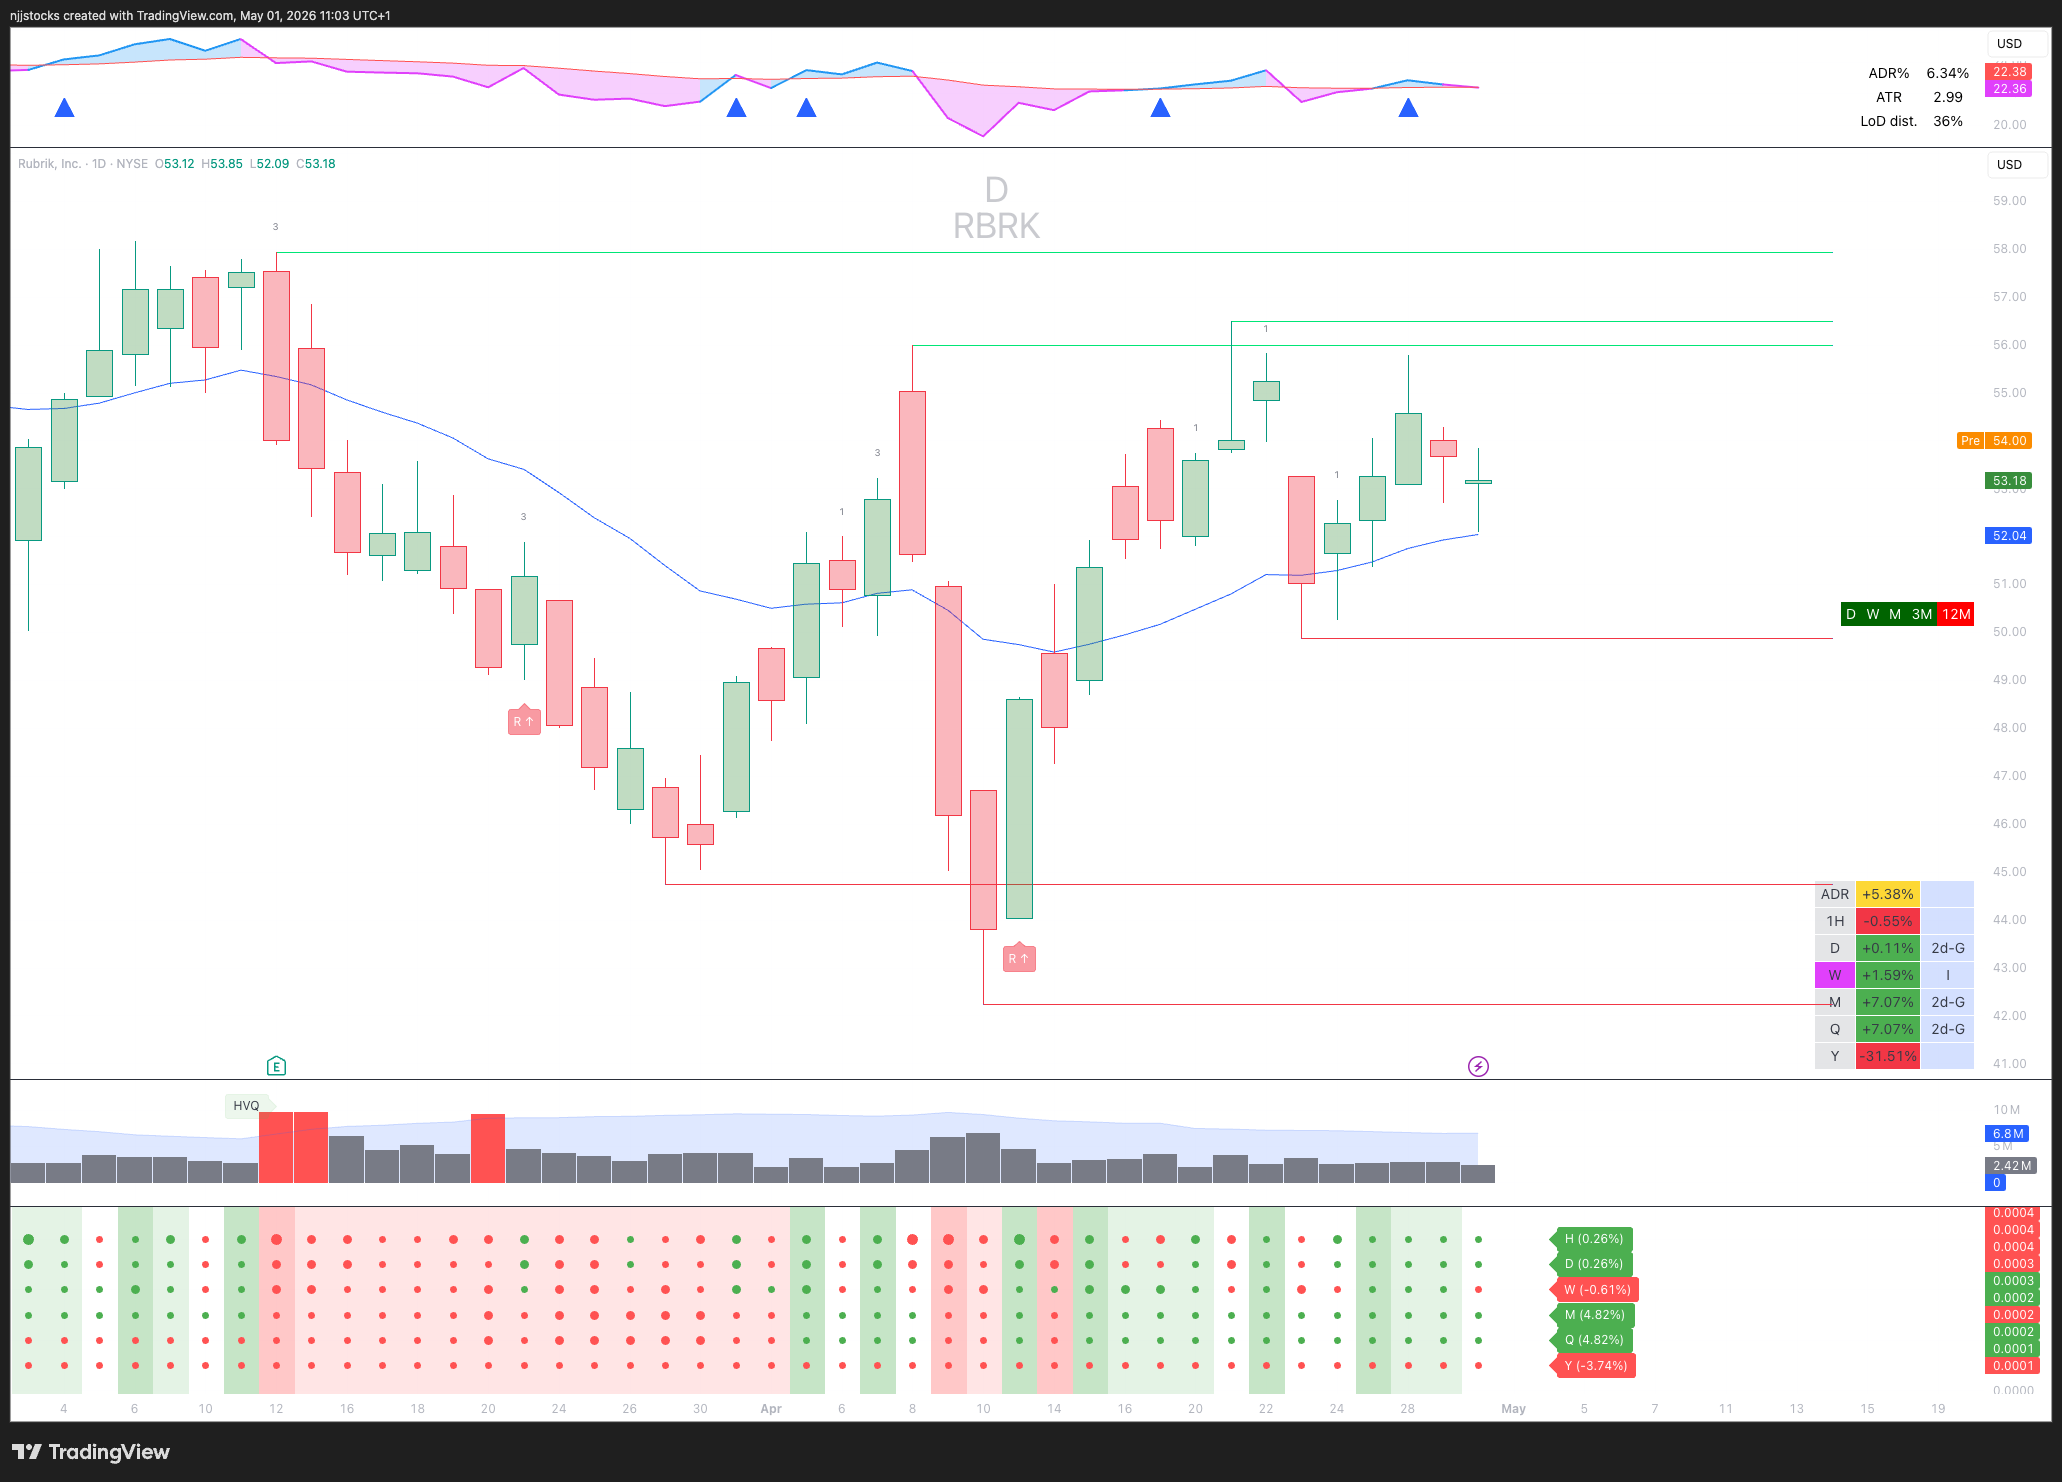
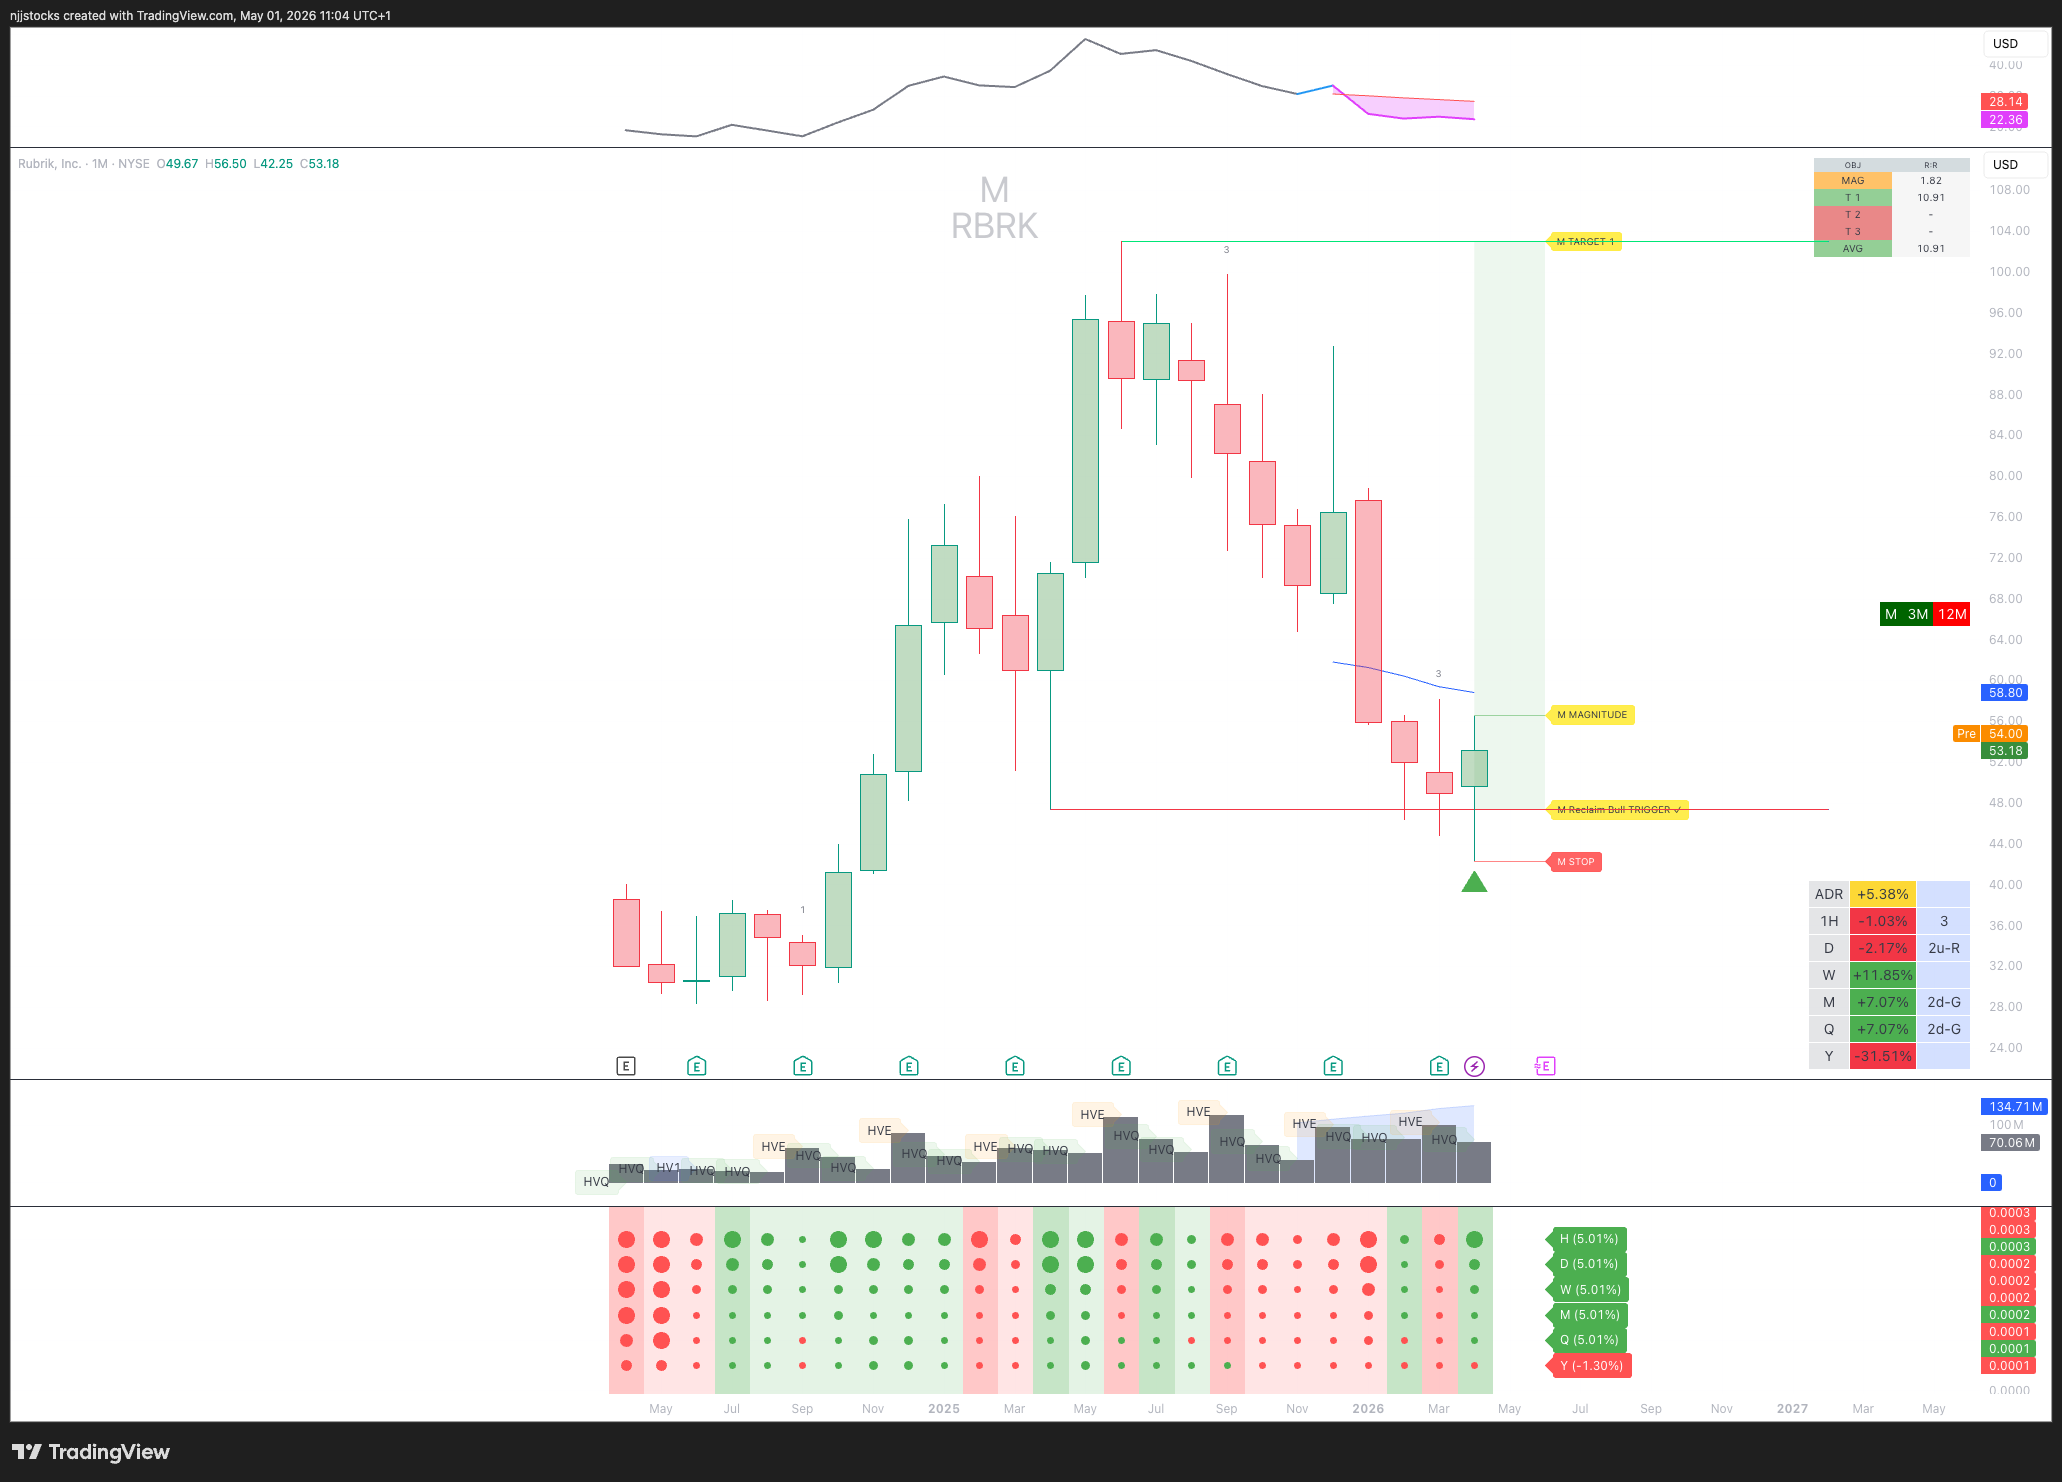
But I’m not as bullish on this one, and here’s why.
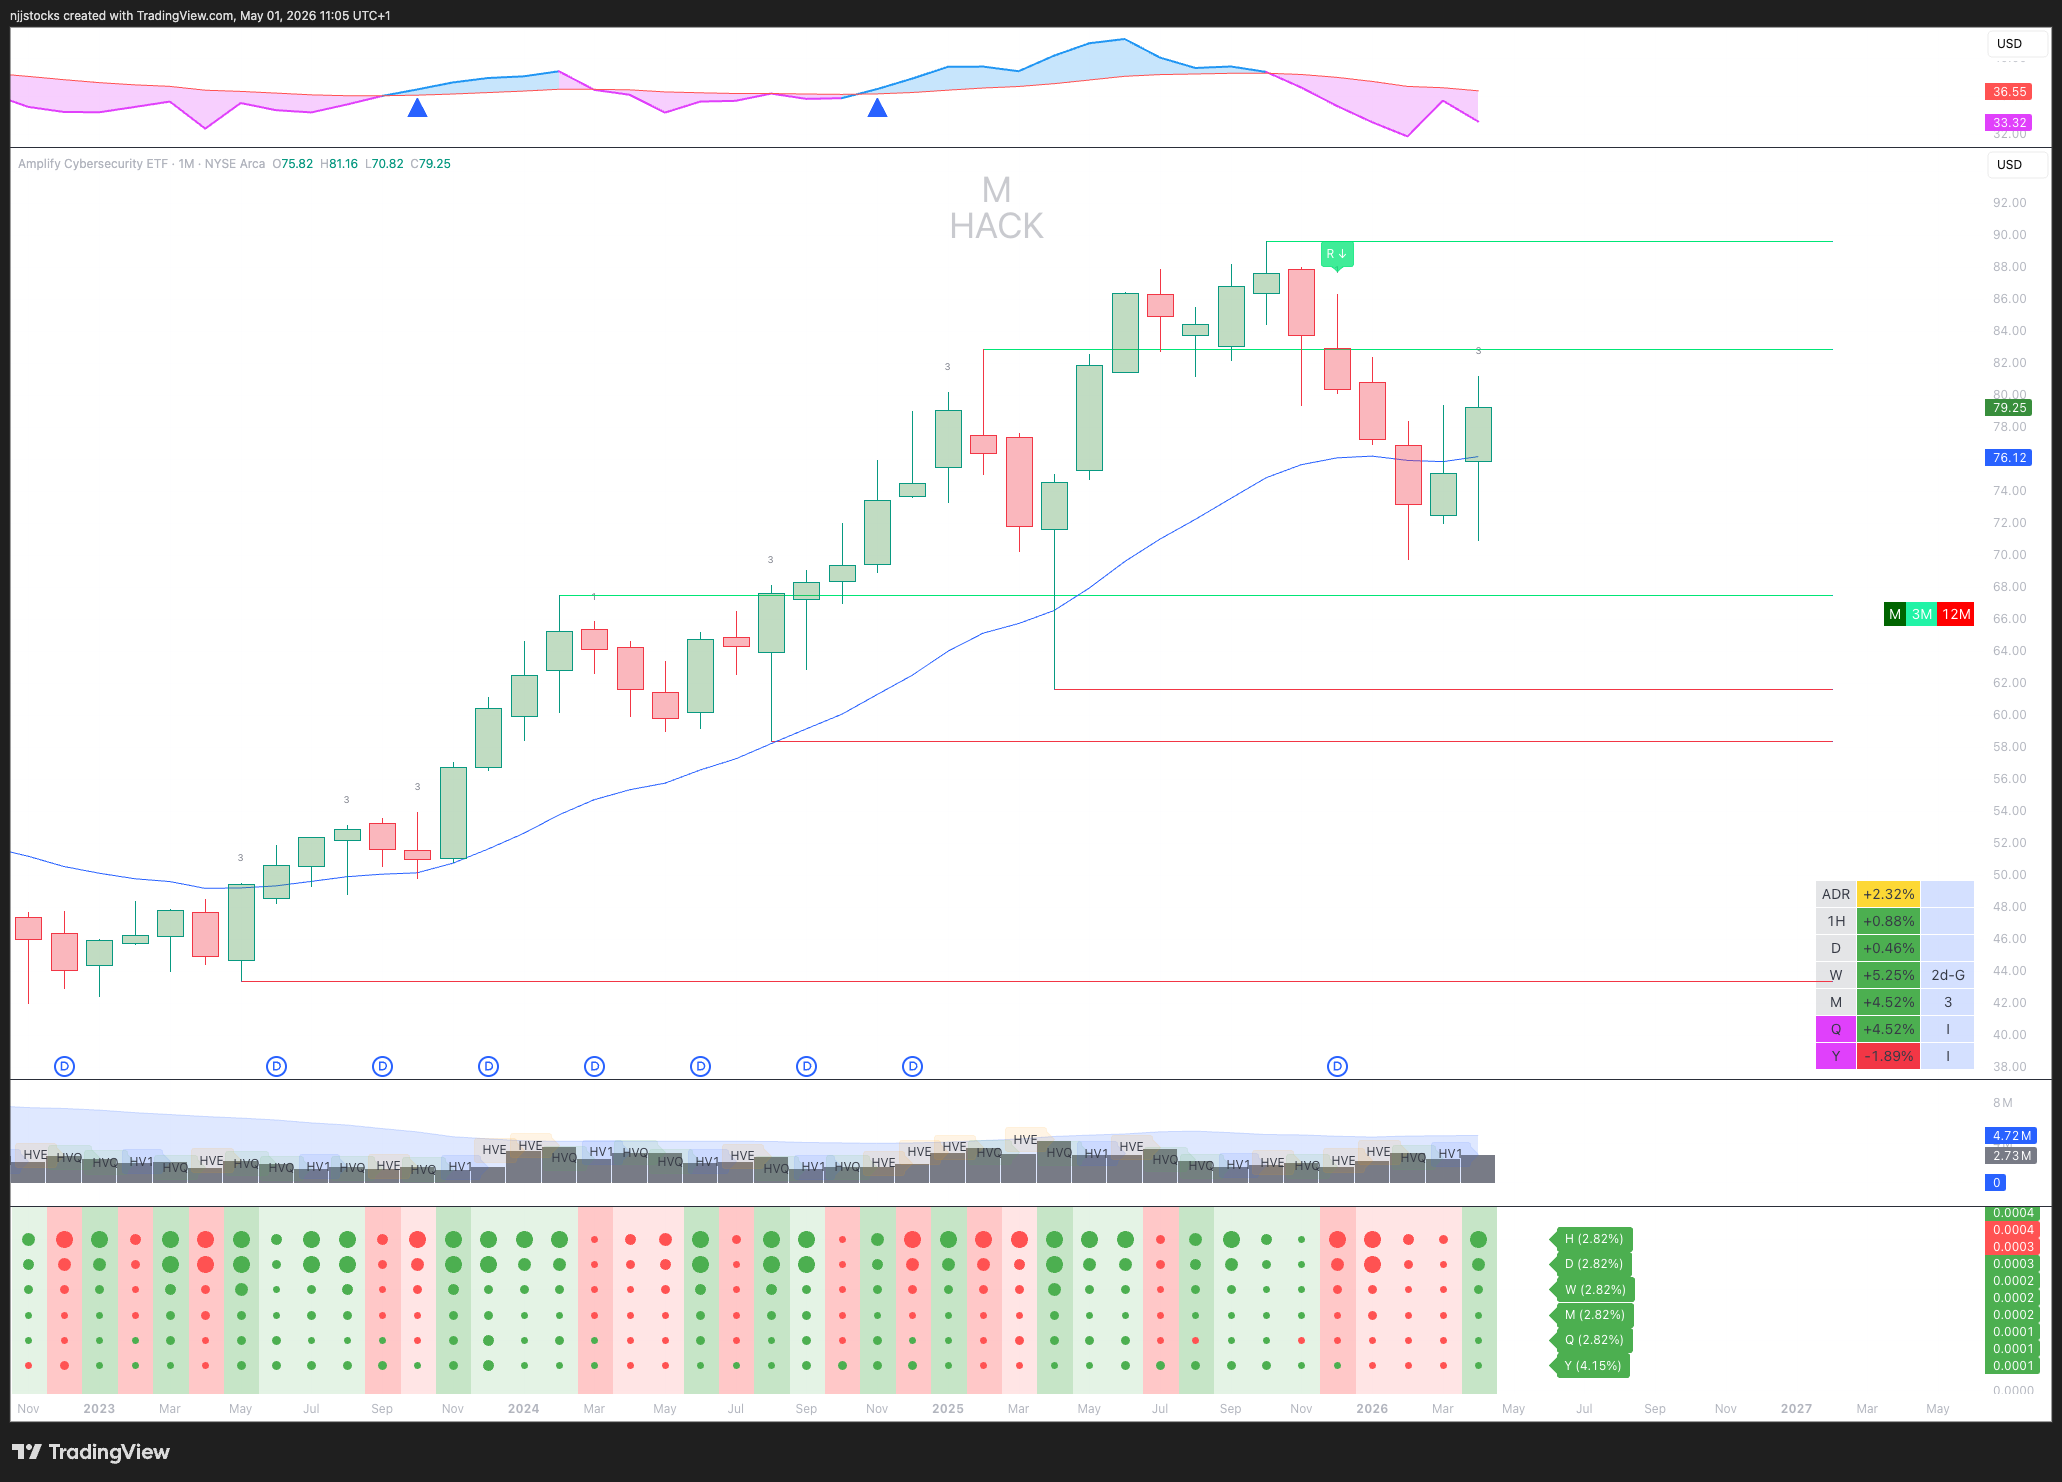
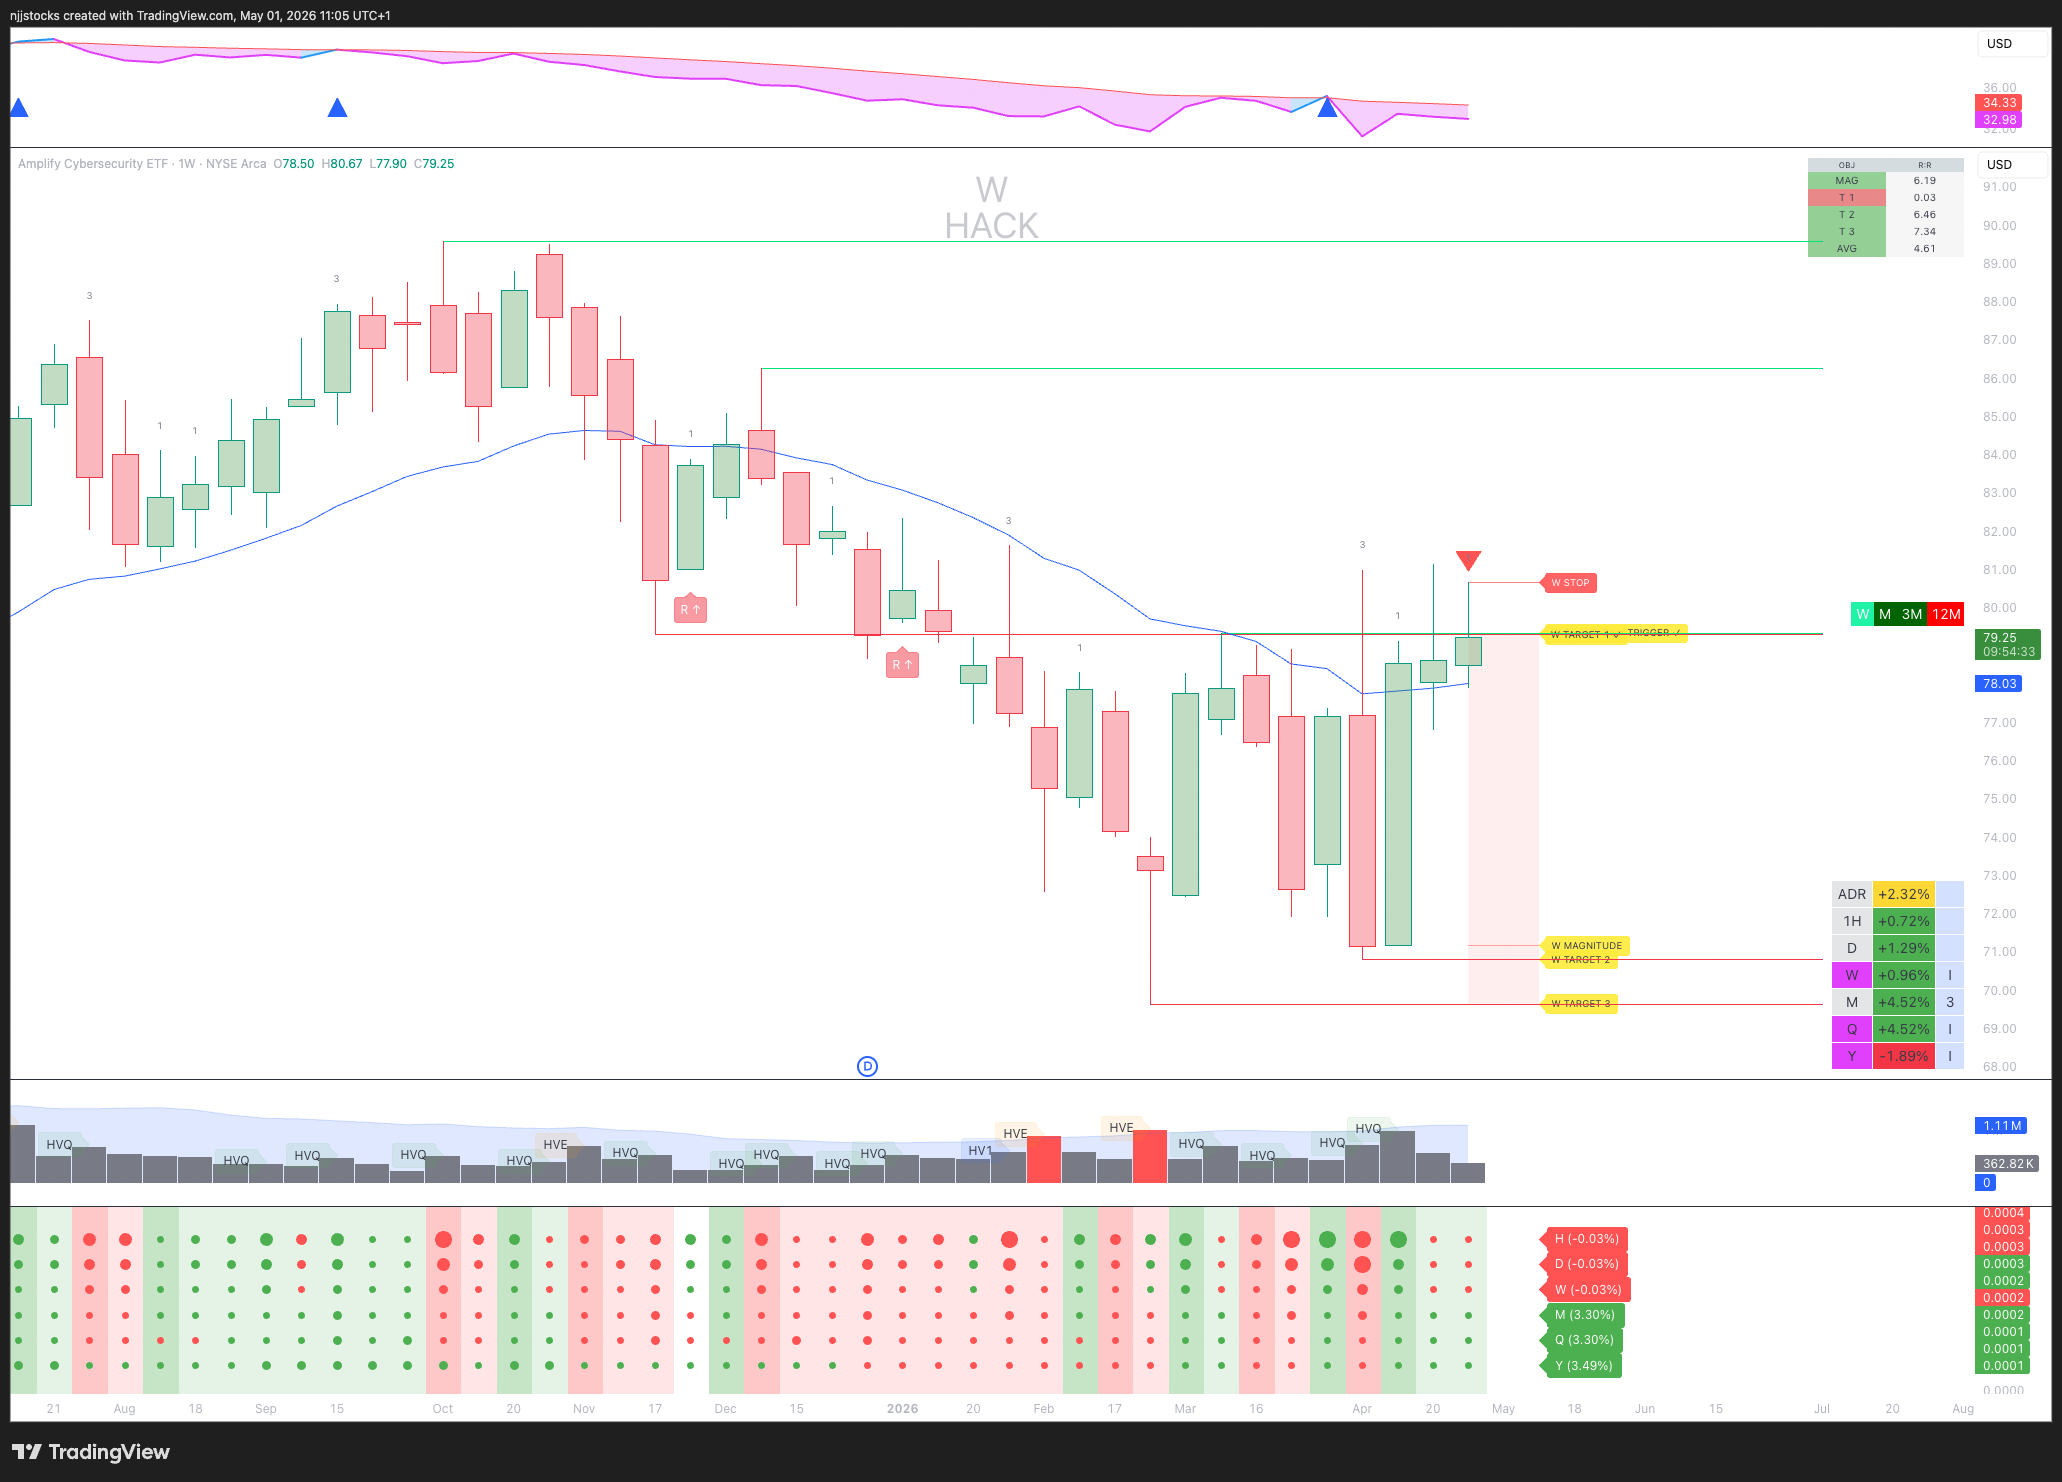
While the $HACK sector is printing a monthly 3-up, the weekly is still inside and doesn’t show the same level of strength we saw in $IGV.

On top of that, if you look closely, price closed back below some of the reclaimed levels from a prior swing high.
That detail matters. A failed reclaim — price coming back above a taken-out level and then closing back below it — is one of the most bearish signals you can see. It tells you the buyers tried, and they couldn’t hold it. My conviction on $RBRK is lower than $GTLB at this stage. As more evidence presents itself in the new month, we’ll reassess.
The question is the edge
Most traders look at a a setup and ask: should I buy this?
That’s the wrong question. It puts you in prediction mode. You’re trying to be right.
The right question is: what’s the next 2, and what will it create, negate, or do? That puts you in preparation mode. You’re not trying to be right — you’re building a thesis, setting your line in the sand, and letting price tell you which path it’s taking.
That shift in thinking is subtle. But it changes everything about how you sit in a trade.
If this was useful, share it with someone who’s still trading off the daily candle alone. They need this more than they know.