
Undercut and Rally
The shakeout that turns into opportunity

When the indexes pull back into key moving averages, the best stocks do not always break down with them. Some behave like a balloon held under water: they get pressed lower for a moment, but the pressure does not change the fact that they want to rise again.
They typically tend to ‘Undercut and rally’. Price dips below a key level, shakes out weak hands and then snaps back above support before the breakdown can gain traction. It is one of the cleanest ways to spot stocks that are still acting well even when the broader tape is under pressure.
What is an ‘Undercut and rally’
An undercut and rally happens when price briefly trades below a meaningful level and then closes back above it. That level might be a prior low, a moving average or another obvious support point on the chart.
The move below support is the shakeout. The reclaim is the signal. In TheStrat terms, this often shows up as a 2dG or a hammer-style reversal, both of which suggest sellers pushed too far and buyers stepped back in.
Why it matters now
This setup becomes especially interesting when the broader indexes are pulling back into support. In that kind of environment, a lot of stocks are being tested at the same time. Some truly break down. Others get pushed lower briefly and then start to reclaim key levels.
Those are the names worth focusing on. A good undercut and rally is not just a random green candle after weakness. It is a failed breakdown inside a stock that still has structure, participation and a realistic chance of resuming trend.
How to scan for it
The strength of this scan is that it is built with layered logic. It does not rely on a single candle or a single indicator. The ANY and ALL groups each have a job to do.
Trigger
This group is set to ANY:
Current Candle 1D = 2dG
Current Pattern 1D = Hammer
That gives the scan two valid ways to catch the reversal. Not every undercut and rally will print the exact same candle structure, so the trigger needs flexibility.
Location
This group is also set to ANY:
ATR Mult EMA 10 between -1.25 and 1.25
ATR Mult EMA 21 between -1.25 and 1.25
ATR Mult SMA 50 between -1.25 and 1.25
This keeps the setup anchored near an important moving average. The goal is to find stocks being tested at levels that actually matter.
Trend strength
This group is set to ANY:
Slope EMA 10 > 10
Slope EMA 21 > 10
Slope SMA 50 > 5
This is a good way to make sure at least one part of the trend is showing real strength. The stock does not need every moving average to be steep, but it does need evidence that the trend is still alive.
Momentum filter
This group is set to ALL:
DCR > 60
This helps keep the list focused on names with stronger candle quality and better closes. It is a useful filter for avoiding weak charts that happen to bounce for a day.
DCR (Daily Closing Range) measures how strong a stock’s close is by showing where the current price sits within that day’s high-to-low range.
Trend Confirmation
This group is set to ALL:
Slope EMA 10 > 0
Slope EMA 21 > 0
Slope SMA 50 > 0
This is the broader structural check. It makes sure the stock is not trying to undercut and rally inside a declining trend.
Participation and Relative strength
This final group is set to ANY:
Relative Volume > 1
RS 1M > 80
RS 1Q > 80
This is an important addition. Relative volume tells you there is participation. The relative strength filters help keep the scan focused on names that have already shown leadership.
Why the group logic matters
The real edge in this scan comes from how the logic groups are combined. ANY groups give the setup room to show up in different valid ways. ALL groups enforce discipline where confirmation matters most.
That balance is what makes the scan practical. Too tight and it misses good names. Too loose and it starts surfacing random bounce candidates that do not have the structure to continue.
How to read the results
Scan results for 9 Jun
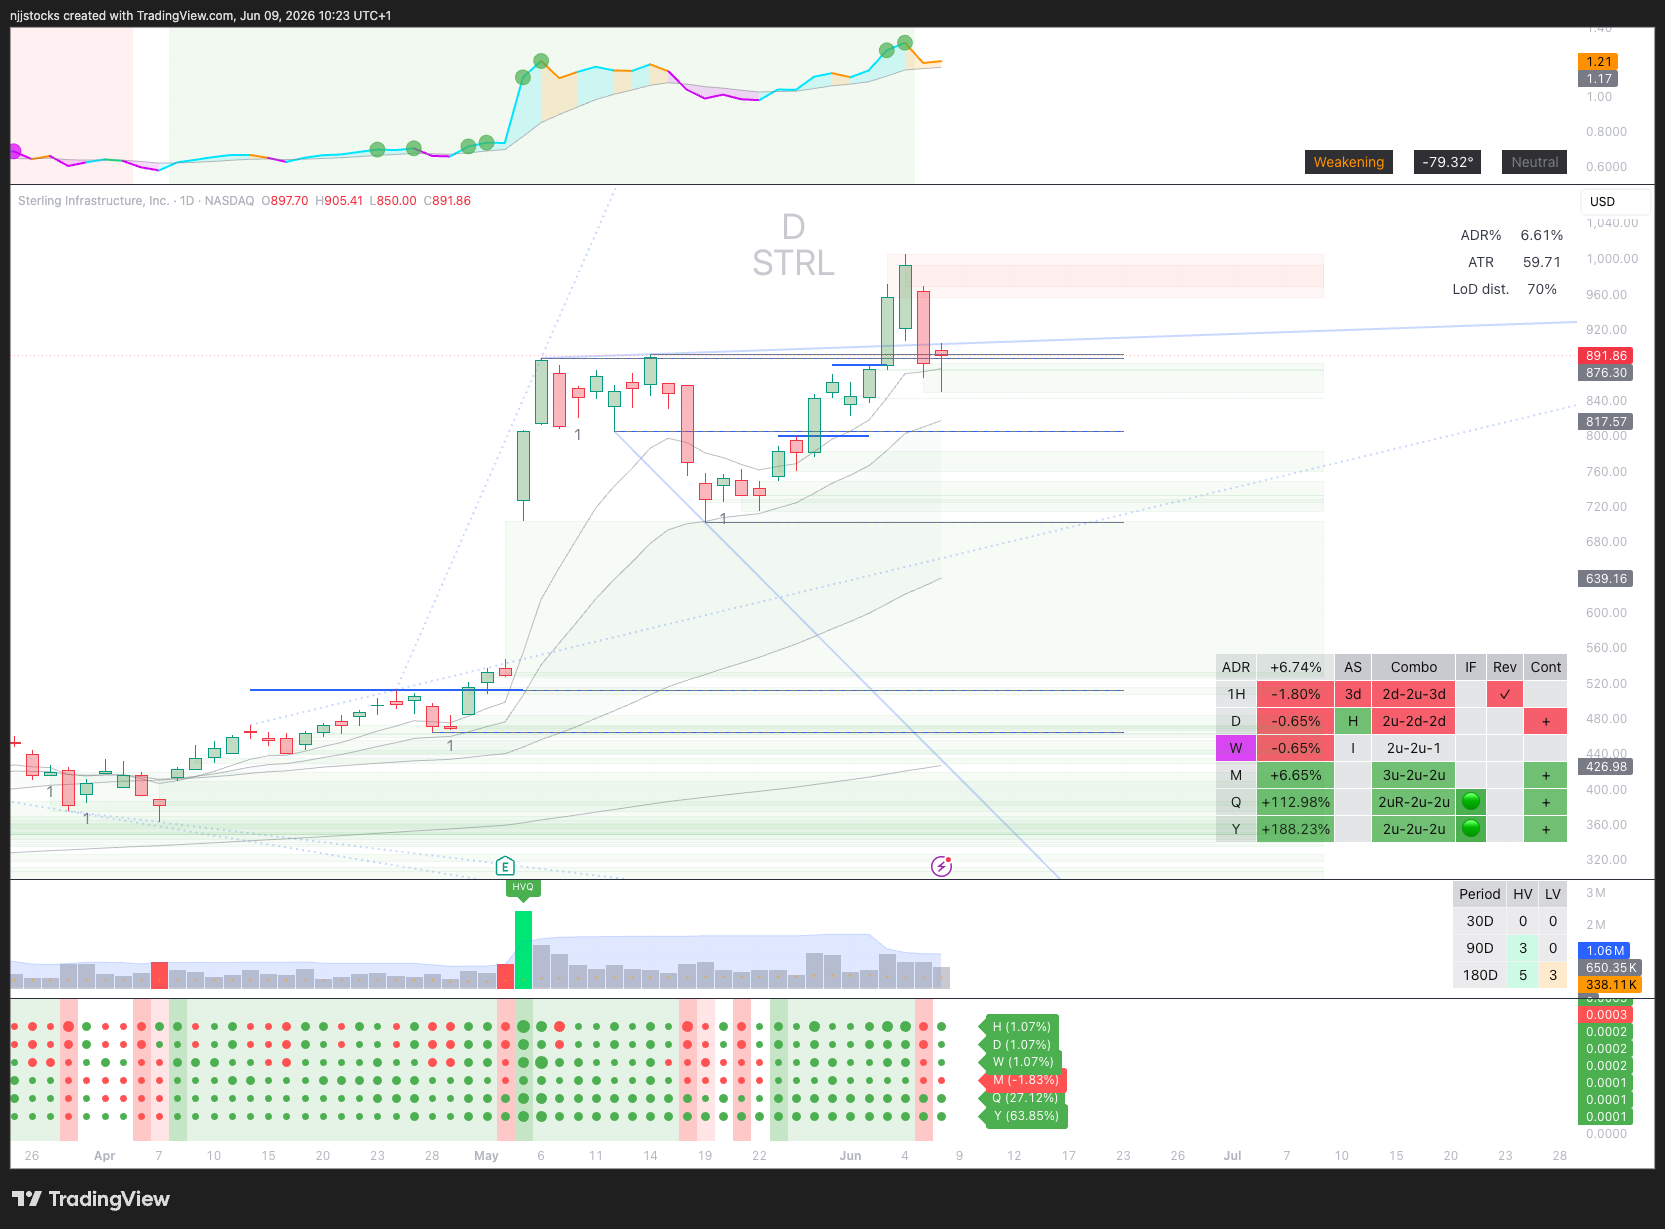
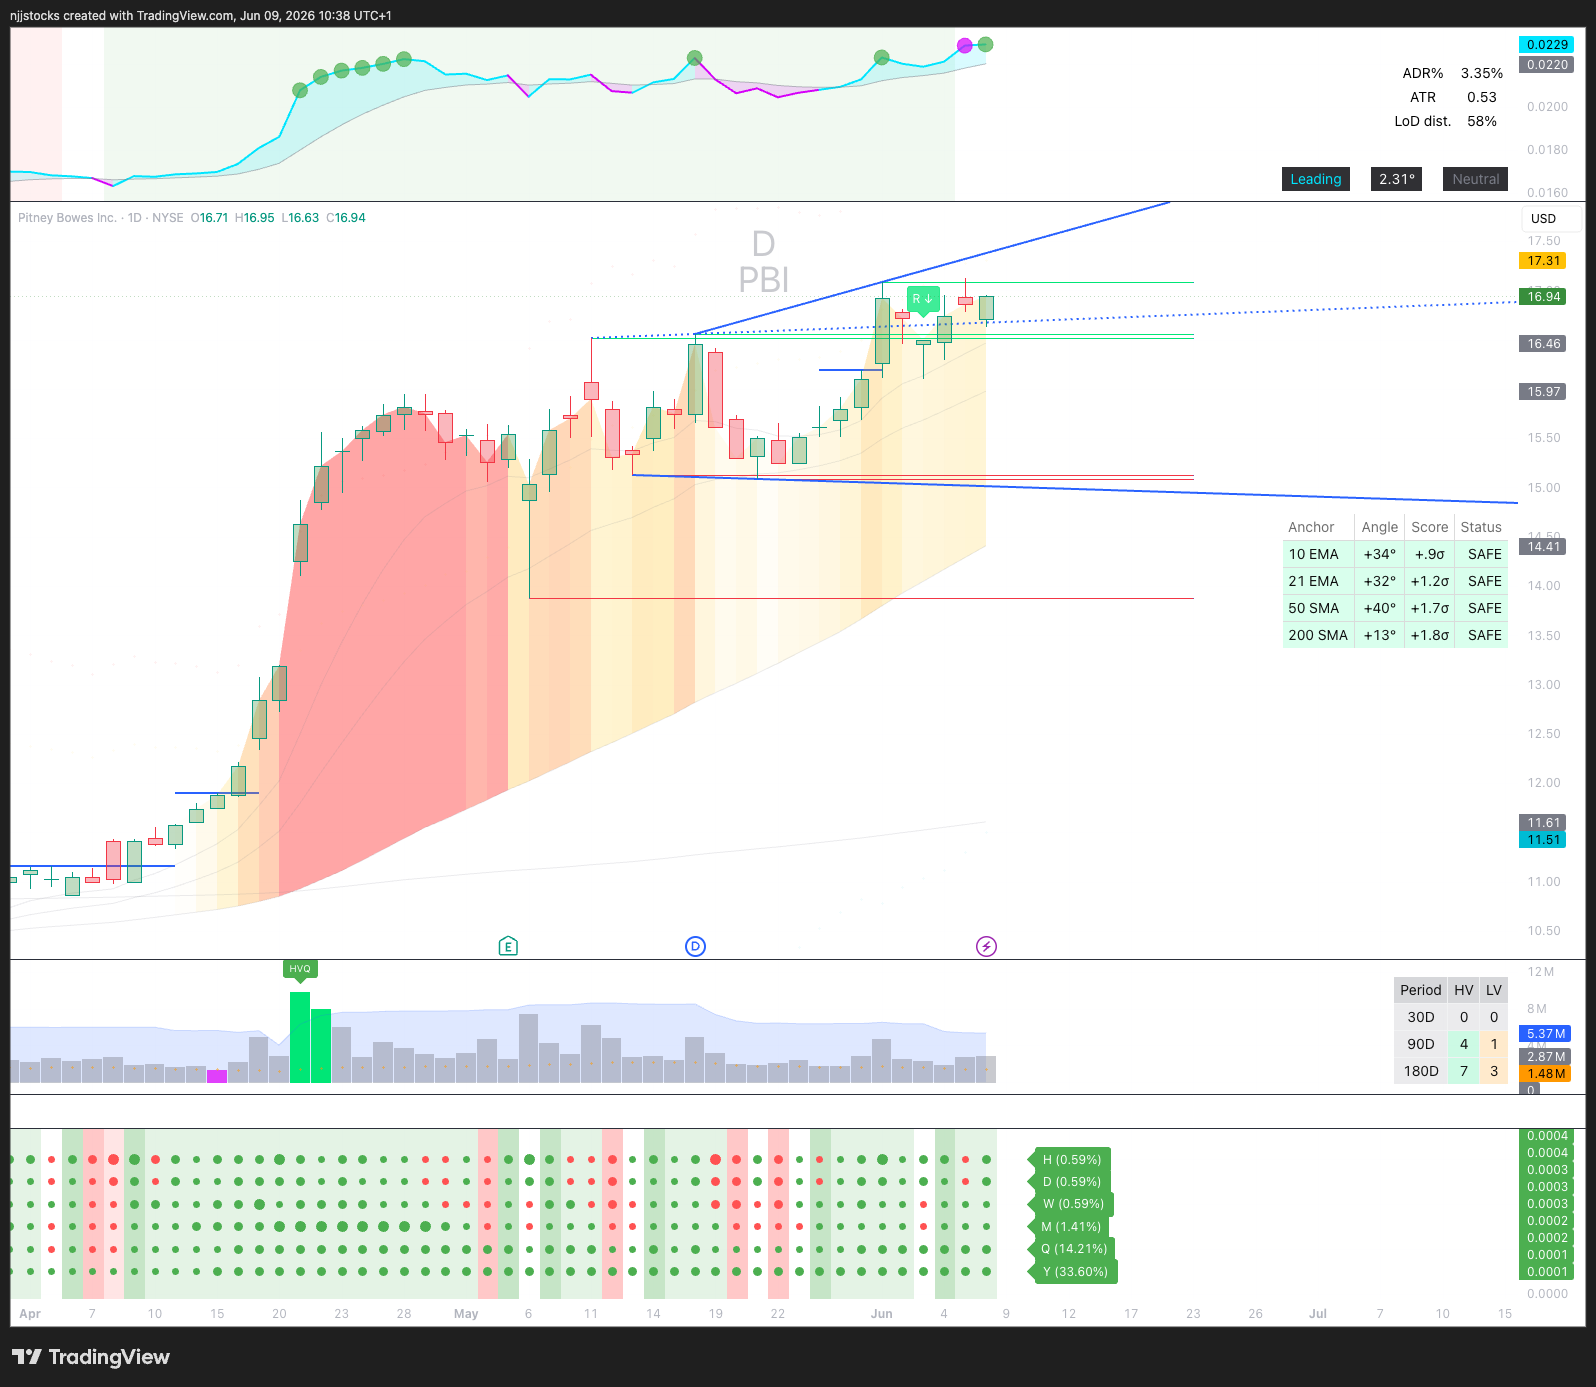
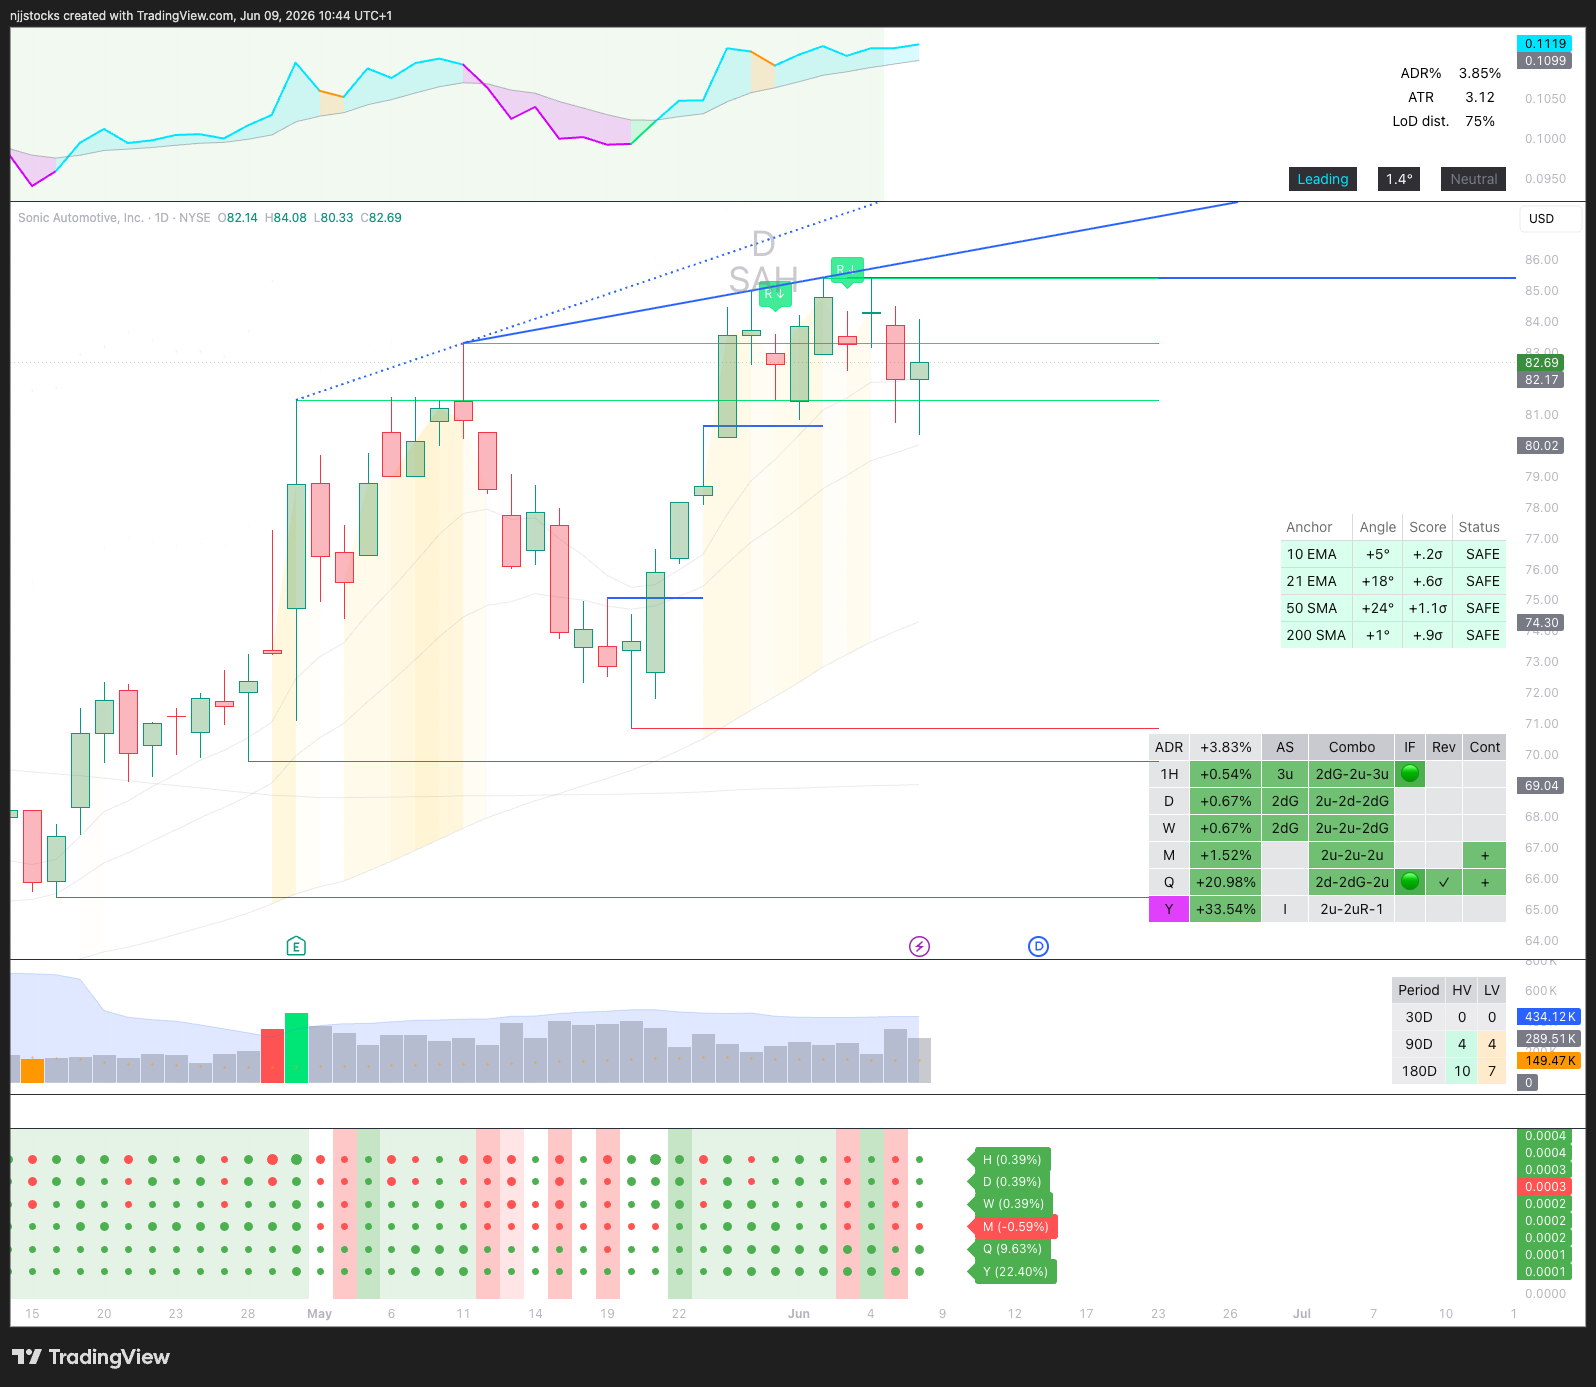
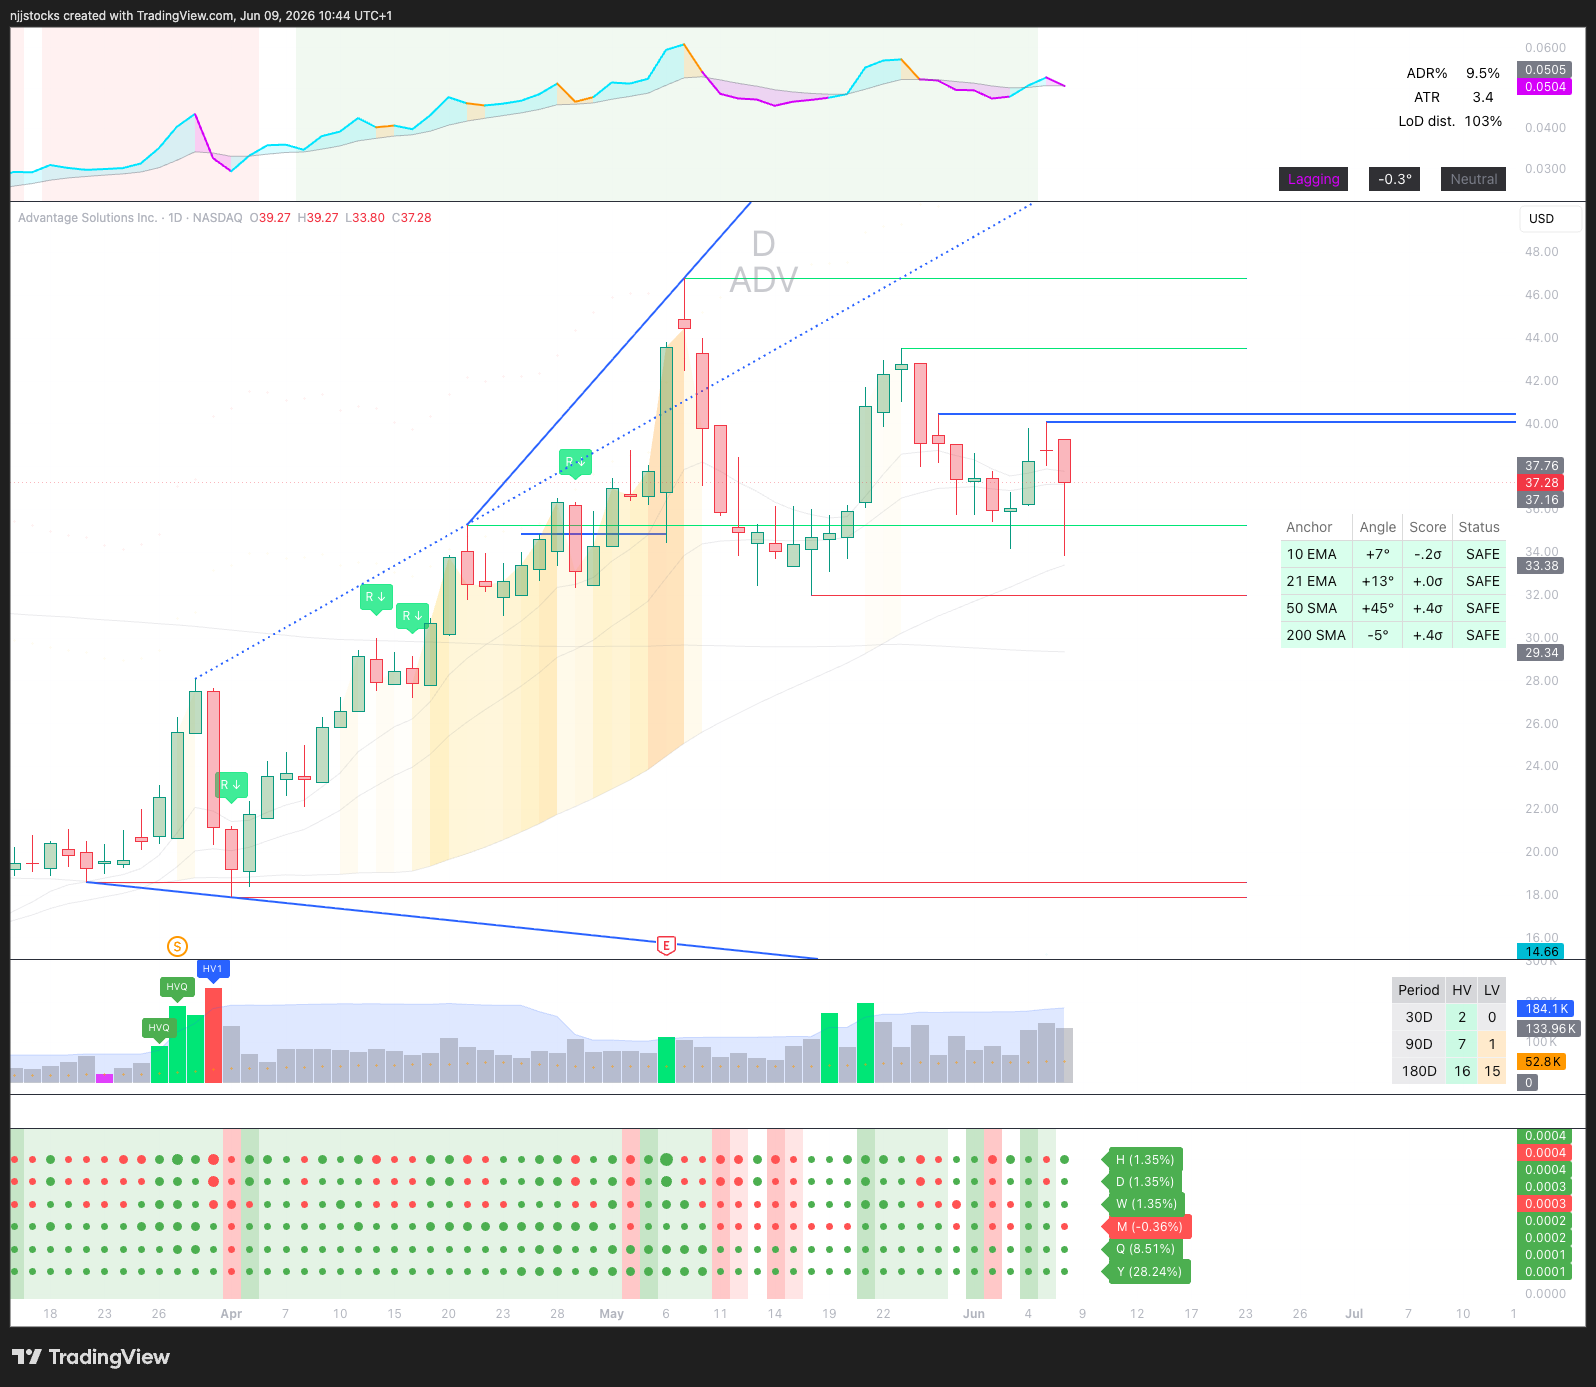
DELL, JHX, WDAY, PBI, RDDT, NTAP, TWST, SWK, EVER, STRL, QLYS, ZD, ECG, GRDN, SAH, WLY, TRNS, IESC, ADV, MSBI, MPTI
This scan should be treated as a shortlist, not an automatic buy list. Once a name appears, the next job is to inspect the chart and confirm that the undercut happened at a meaningful level and that the reclaim has real intent behind it.
The checklist is simple:
Did price undercut a meaningful level?
Did it reclaim that level quickly?
Is the larger trend still intact?
Did the move happen with participation?
Is there nearby overhead supply?
If the answer is yes, then the stock deserves closer attention.
A few that caught my attention
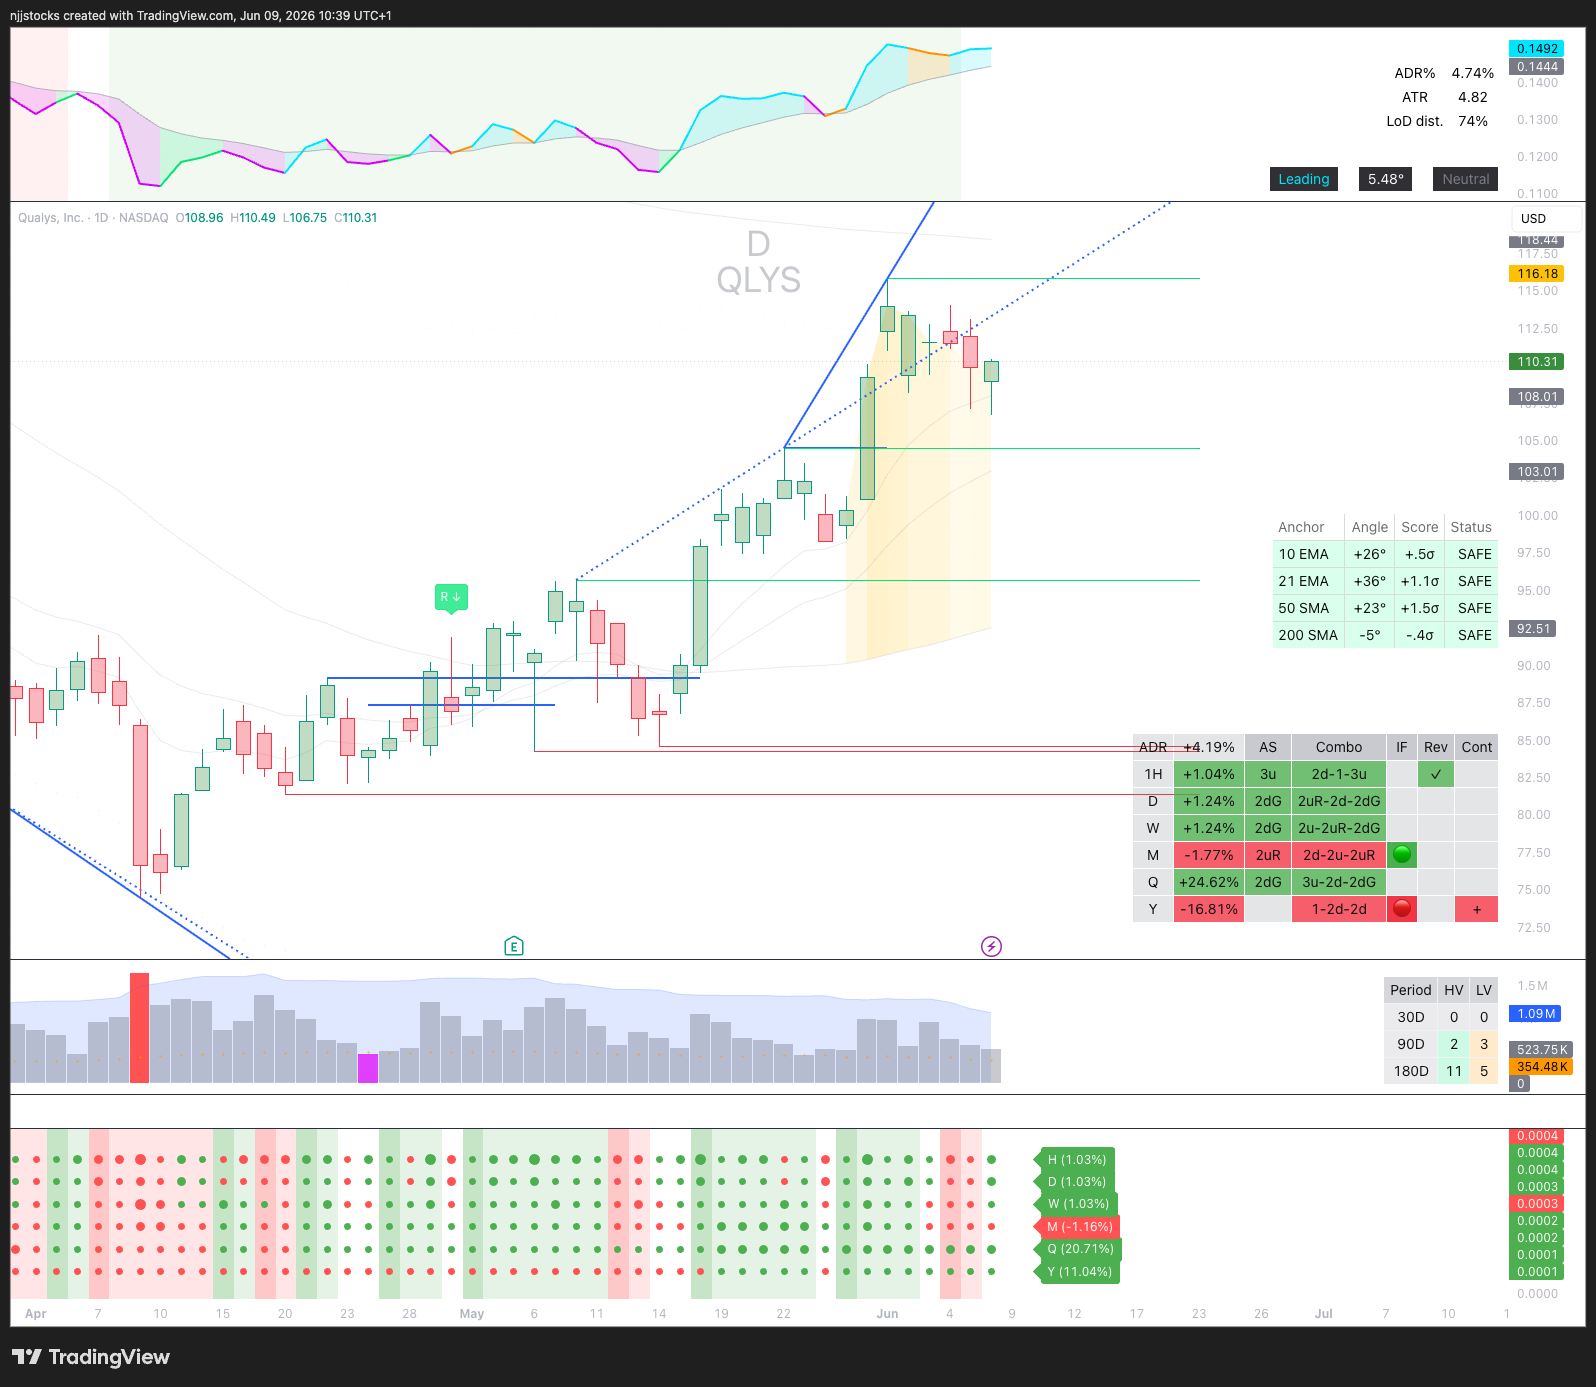
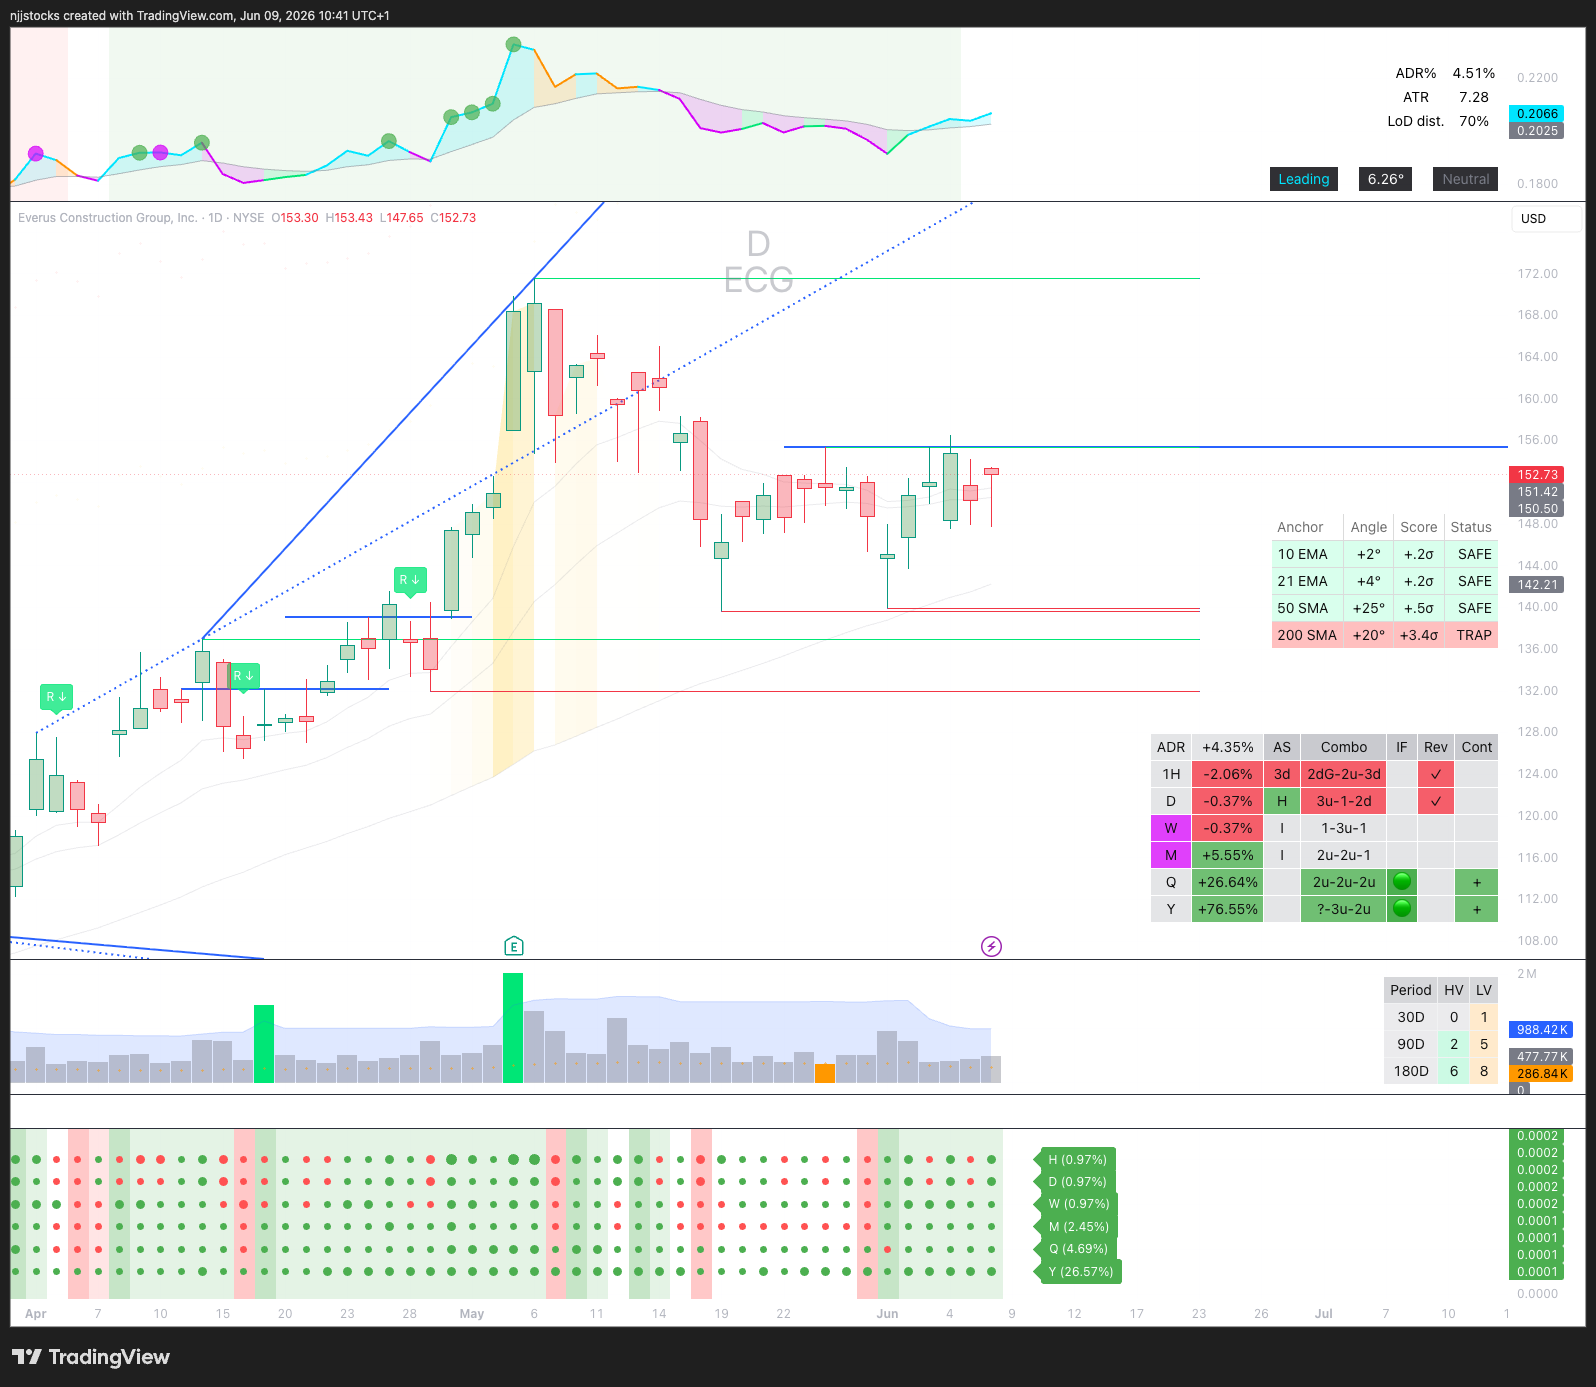
And here are some examples that meet the criteria, but don’t look right
Keep the ‘Market’ in context
Undercut and rallies are interesting, but they should never be read in isolation. The broader market still sets the tone and that should shape both expectations and position sizing.
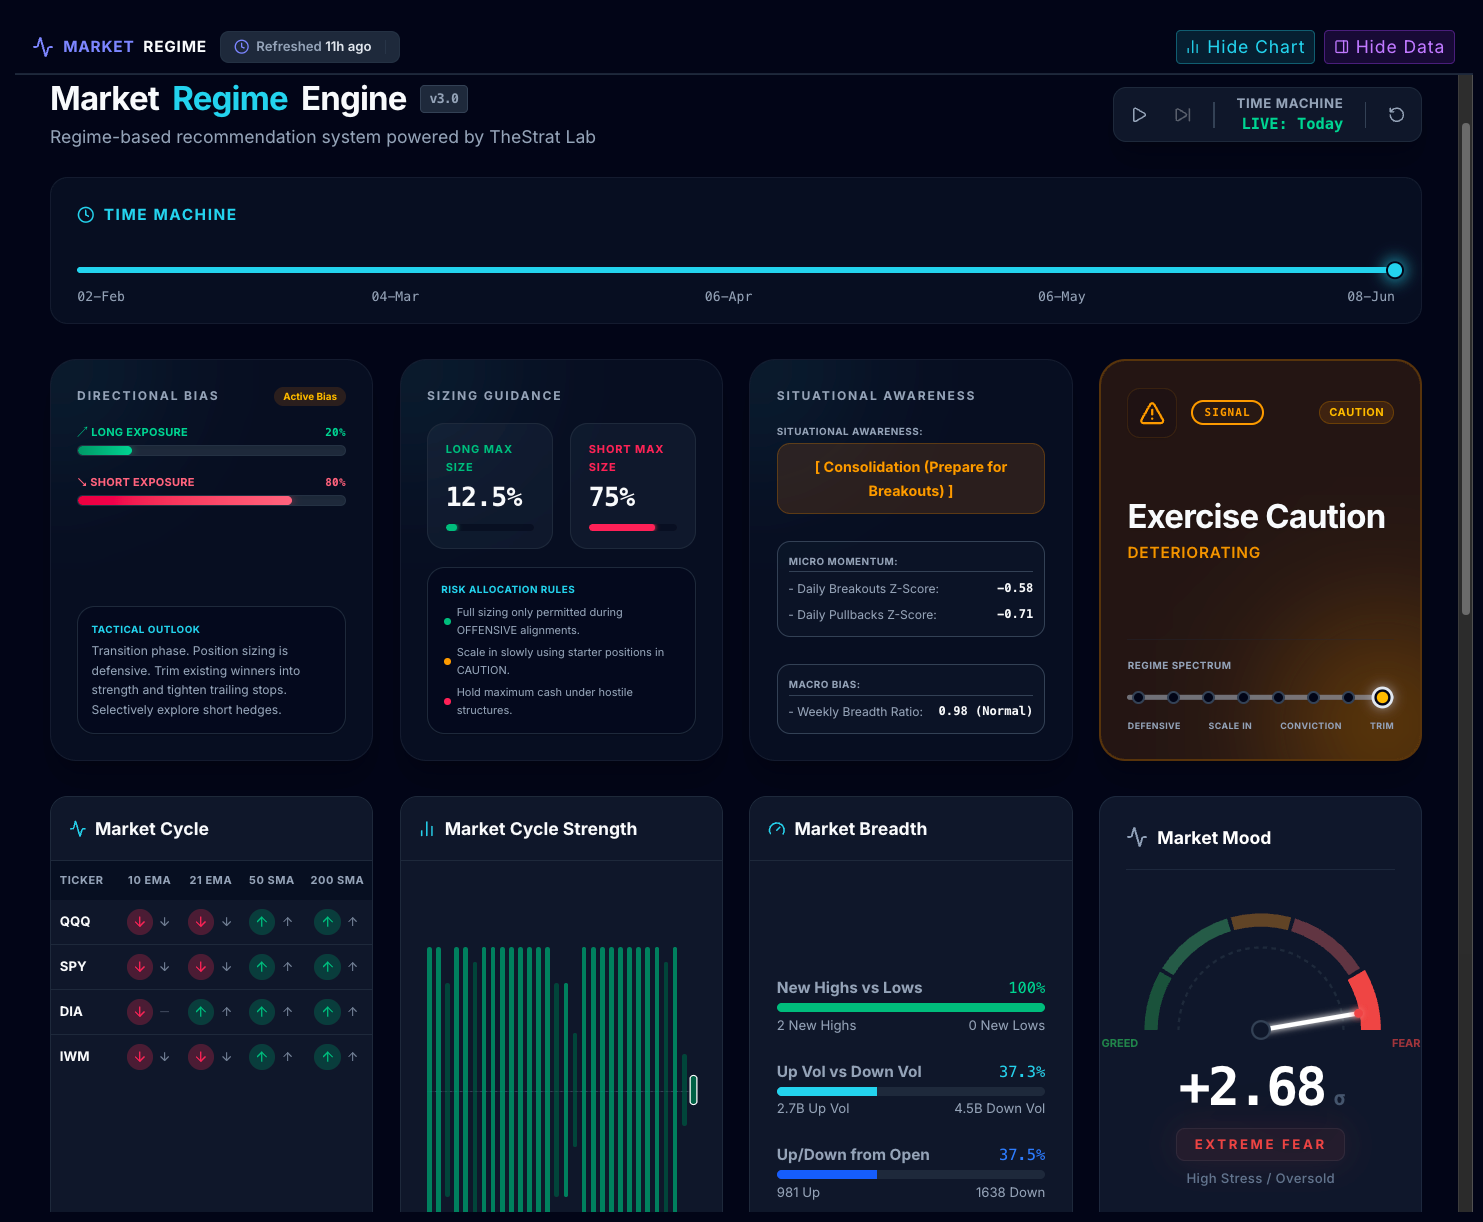
If the indexes are deteriorating, caution matters more than enthusiasm. In that kind of tape, even strong-looking reclaim setups deserve smaller size, tighter risk and more selective execution.
The goal is not to ignore the setup. The goal is to respect the regime around it. A strong stock can still bounce, but when the broader market is unstable, it makes sense to stay measured and size accordingly.
Entry and Risk
More aggressive traders may enter on the reversal candle, while more conservative traders may wait for a retest of the reclaimed area or a break above the reclaim candle’s high.
The stop usually sits just below the undercut low. If price loses that level again, the setup is likely invalid. That is one of the pattern’s best features: clear invalidation and well-defined risk.
Final thought
The undercut and rally is really about finding stocks that were pressured, not broken. Weak names stay underwater. Strong names act like that balloon: they get pushed down, hold their character and rise again when the pressure starts to come off.
In a market pullback, that is where the opportunity often sits. Not in guessing bottoms, but in identifying the names that prove they still want higher prices.
Can you do me a favour?
If this piece resonated with you and you’d like to support the work, TheStrat Protocol is available now on Amazon. If you’re already a Kindle Unlimited subscriber, it won’t cost you a penny — just your time. If you’ve already purchased The Strat Protocol — thank you, genuinely.
Morning! I’m pretty new to this website. Do you guys have any docs or tutorial videos that show how to use it?