The Broadening Formation Algorithm
How to programatically draw a broadening formation

This one is for EasyName, who asked the question everyone is thinking but most people don't ask: "Do you have a formal logic to define the broadening formation? Something you could code up instead of going visually?" .
The broadening formation has a formal logic. Here’s how you define it, step by step and how you draw it correctly.
Step 1: Identify your ‘Pivots’
Start by identifying swing highs and swing lows, but only on confirmed, closed bars.
The pivot length is the key variable. It’s also the only subjective element of the whole thing.
Think of it as a window. If your pivot length is 8, the algorithm looks at 8 bars to the left and 8 bars to the right of any candidate bar. If that bar has the highest high across all 17 bars in that window, it qualifies as a swing high. Same logic in reverse for a swing low.
The rule is always:
Swing High = highest high within N bars left and N bars right
Swing Low = lowest low within N bars left and N bars right
Step 2: Choosing Your Pivot length
This is the secret sauce. The pivot length you choose determines which swings you see and which ones you miss.
Every chef has their own recipe. They're not giving it out. What this article will do is walk you through the ingredients and the process. The specific measurements? Those stay in the kitchen.
First start simple. Use hardcoded values per timeframe. Fix a default pivot length for each chart and get comfortable with what it shows you before touching anything else. Different timeframes warrant different sensitivities. What works on a daily chart won’t be appropriate on a 60-minute.
Then go adaptive. Once you’re comfortable with hardcoded values, you’ll notice the “right” pivot length shifts with market conditions and the character of the stock. Instead of a fixed window, the algorithm calculates pivot length dynamically based on the rate of change of the Average True Range (ATR) over a set lookback — 10 or 14 periods are common starting points.
Higher ATR volatility = shorter pivot length
Lower ATR volatility = longer pivot length
The formation adjusts itself to the ticker and the market condition.
Really important: Pivot length changes dynamically NOT based on ATR, but the Rate of Change of ATR
Step 3: The expansion check
Once you have confirmed pivots, one rule governs the formation:
Each new swing high must be greater than the previous swing high
Each new swing low must be lower than the previous swing low
Both must be true simultaneously. That expanding envelope creating the broadening formation — higher highs and lower lows. The two trendlines diverge from left to right, creating the megaphone shape. .
Step 4: Draw Trendlines
Draw the lines backwards, connecting the most recent pivot to the prior one.
The upper trendline connects the most recent swing high back to the prior lower swing high
The lower trendline connects the most recent swing low back to the prior higher swing low
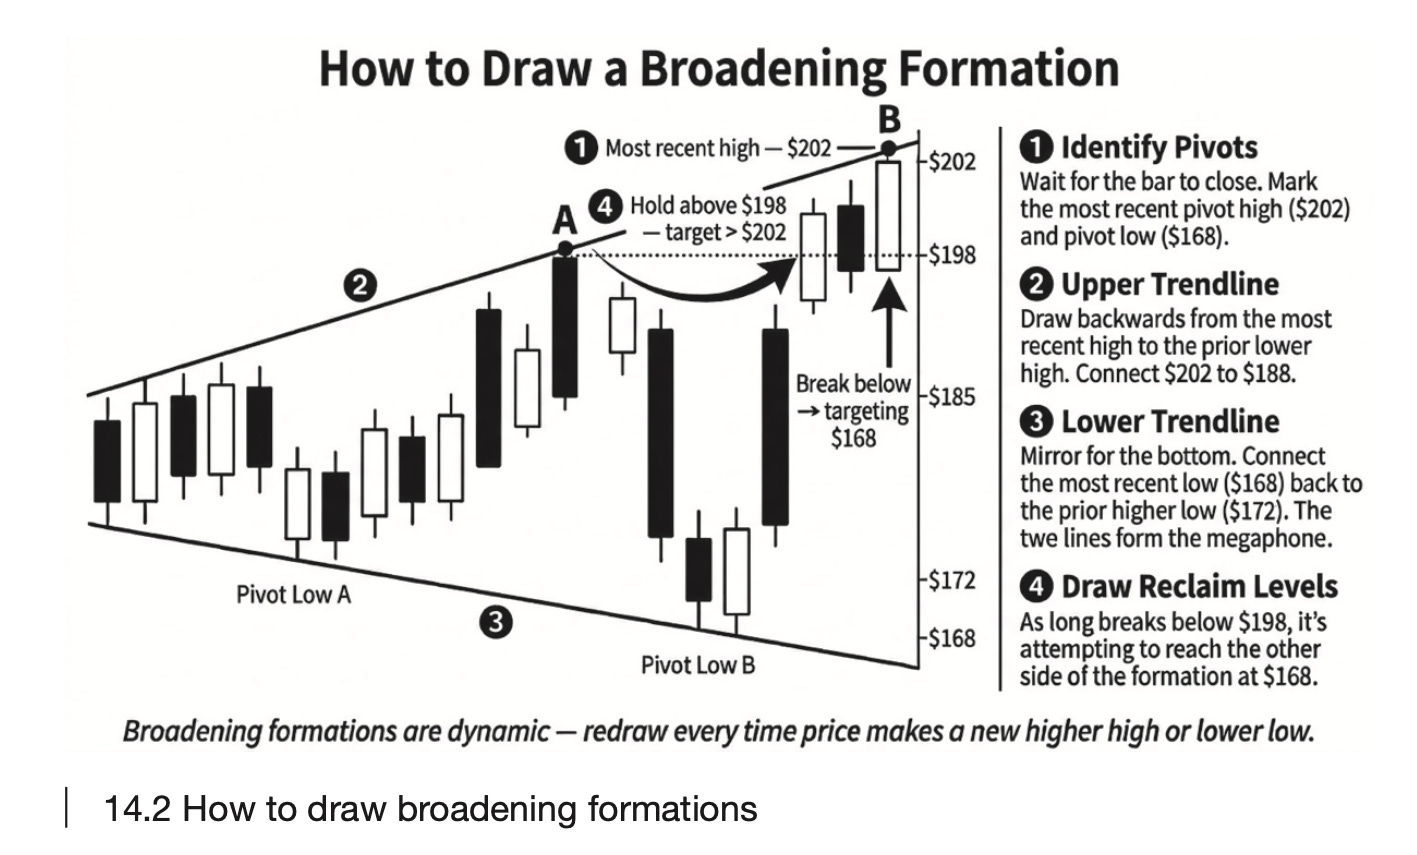
In the example from the book, that means connecting B ($202) back to A ($198) on the upper line, and Pivot Low B ($168) back to Pivot Low A ($172) on the lower. Those two lines form the megaphone.
Here’s a confession. I draw them forward and extend them into the future, so that I can visualise magnitude.
Step 5: Mark your ‘Reclaim’ levels
At every confirmed swing high and swing low, draw a horizontal line. These are your reclaim levels. This is the most actionable levels the formation produces and probably the most under discussed.
When price breaks below $198 in the example, it is now targeting the other side of the formation at $168.
Equally if the $198 level is not breached, the dynamic has shifted. Prepare for expansion and wait for a reversal to enter.
You can read more about ‘Reclaims’ below
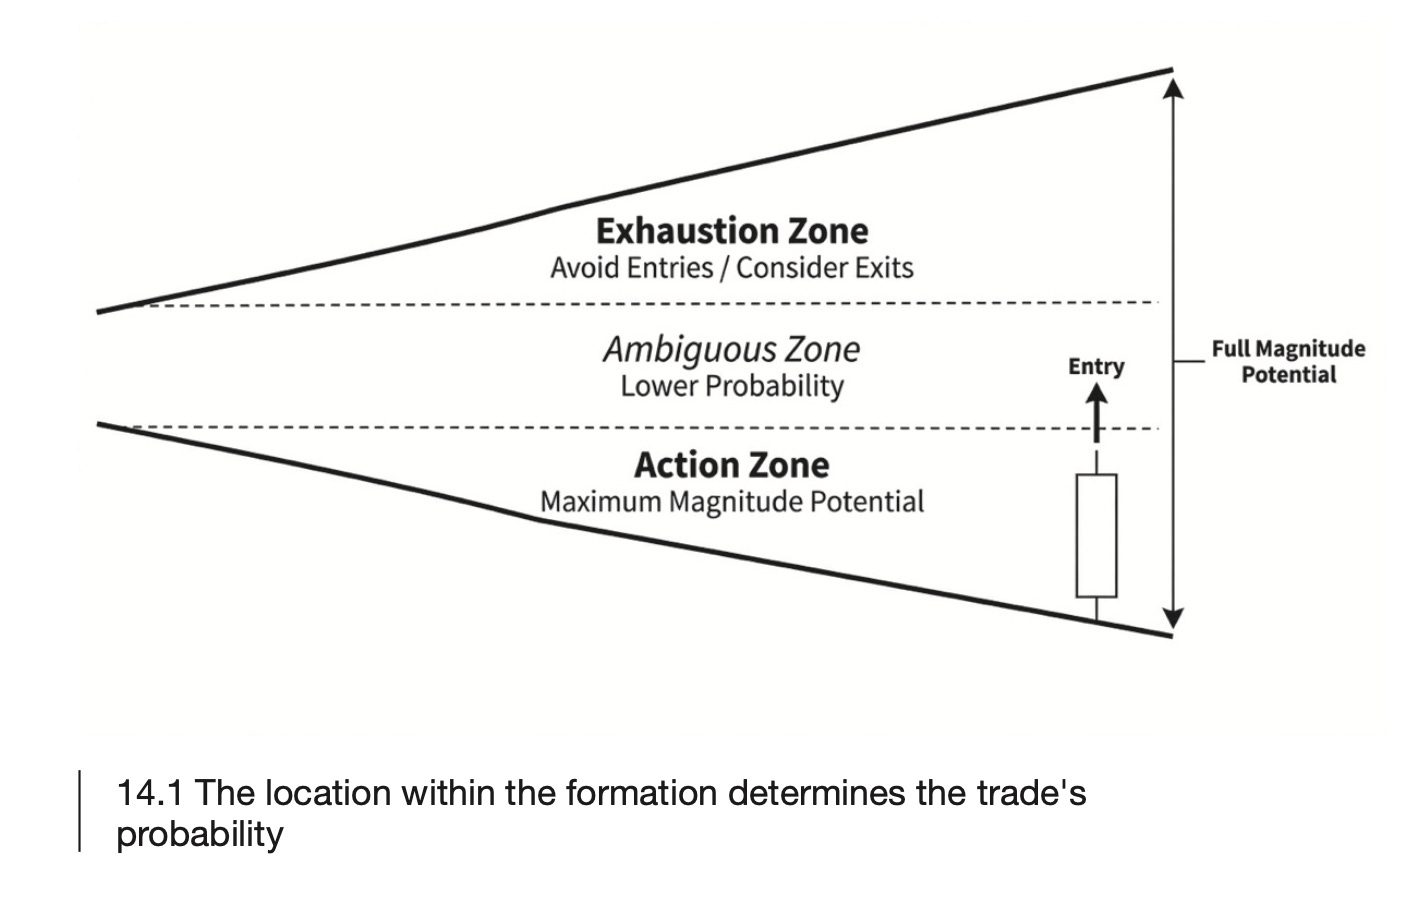
Step 6: Know where you are in the BF
Not all locations inside the formation are equal:
Action Zone — the bottom third of the range. Maximum magnitude potential. This is where you look for longs.
Ambiguous Zone — the middle of the range. Lower probability. Avoid initiating new positions here. Great for adds.
Exhaustion Zone — the top third. Avoid entries. Consider exits and profit-taking instead. If the BF expands, consider adding to your existing position.
Step 7: Re-evaluate continuously
Every time price creates a new swing high or swing low, erase the old lines and redraw. Broadening formations are dynamic: redraw every time price makes a new higher high or lower low.
This makes the broadening formation a continuously evaluated condition, not a one-time visual call.
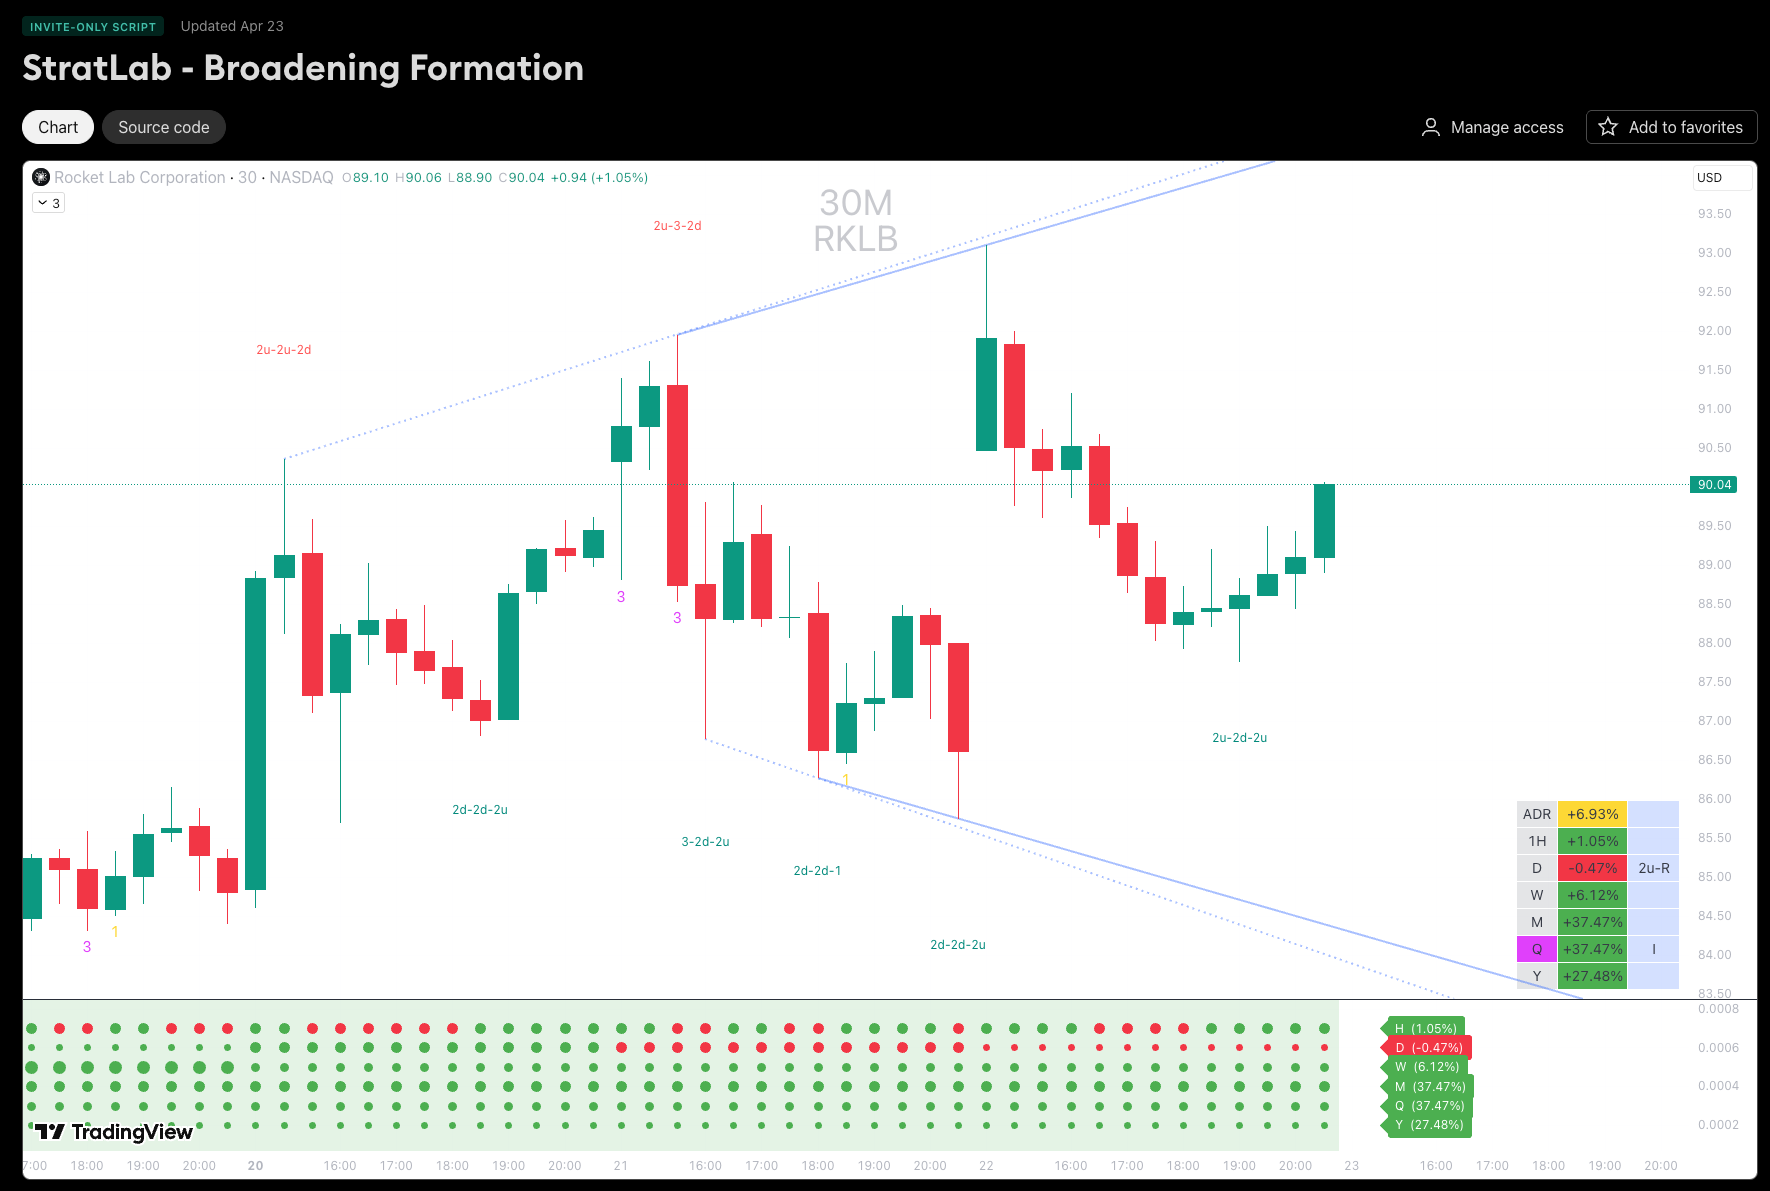
If all of this sounds compelling but you’d rather not build it yourself, I’ve bundled a Broadening Formation indicator for free with the book.